At the start of shifts : Short meetings to get everyone up to speed
SIM (Short Interval Animation) are also referred to more generically as “performance management meetings”. Because that’s exactly what it is organized in shifts (shift work in 2×8, 3×8, 4x,8…) or not, the day generally begins with a team meeting, aimed at :
- take stock of “current affairs” : the level of production the day before, any incidents, action plans in progress, etc.
- share goals for the day to come, such as the number of units to be produced and shipped based on orders,
- assign tasks for each one
It is therefore not a “simple” point of information. On the contrary : these rituals constitute an essential support for the continous improvement of teams and processes.
SIM (Short Interval Management) As its name suggests, an SIM is a quick meeting (from 5 minutes to 1 hour), recurring (daily or by shift in a production unit, weekly as part of a management project), which aims at decision making and problem solving.
To be effective, an SIM is therefore based on a series of clear indicators, making it possible to quickly pinpoint any problems and make informed decisions on a QRQC (Quick Response Quality Control), SQPD (Security Quality Price Delays) or even SQCD (Safety Quality Costs Deadlines).
KPIs that matters
What indicators should be included in a team brief on a production unit ?
In a logic of SQCD management (Safety, Quality, Costs, Deadlines), to which we add more and more often the P for People, here are some ideas of indicators to follow and share during your team rituals.
- Security : Accident rate/ Number by severity, consecutive accident-free days, avaibility of PPE (Personal Protective Equipment)
- Quality : Rate of compliant or defective products, rate of non-compliance per machine, rate of compliant and defective products per work shift
- Cost : Synthetic rate of return (TRS), productivity rate & lead/lag, productivity rate per shift, unused production capacity, number of breakdowns, downtime hours and costs
- Deadline : Average delivery times, average order processing times, average production time per product, reliability of planning and wear
- People : Employee planning, training to follow (and followed), versatility
The contribution of digital visual management
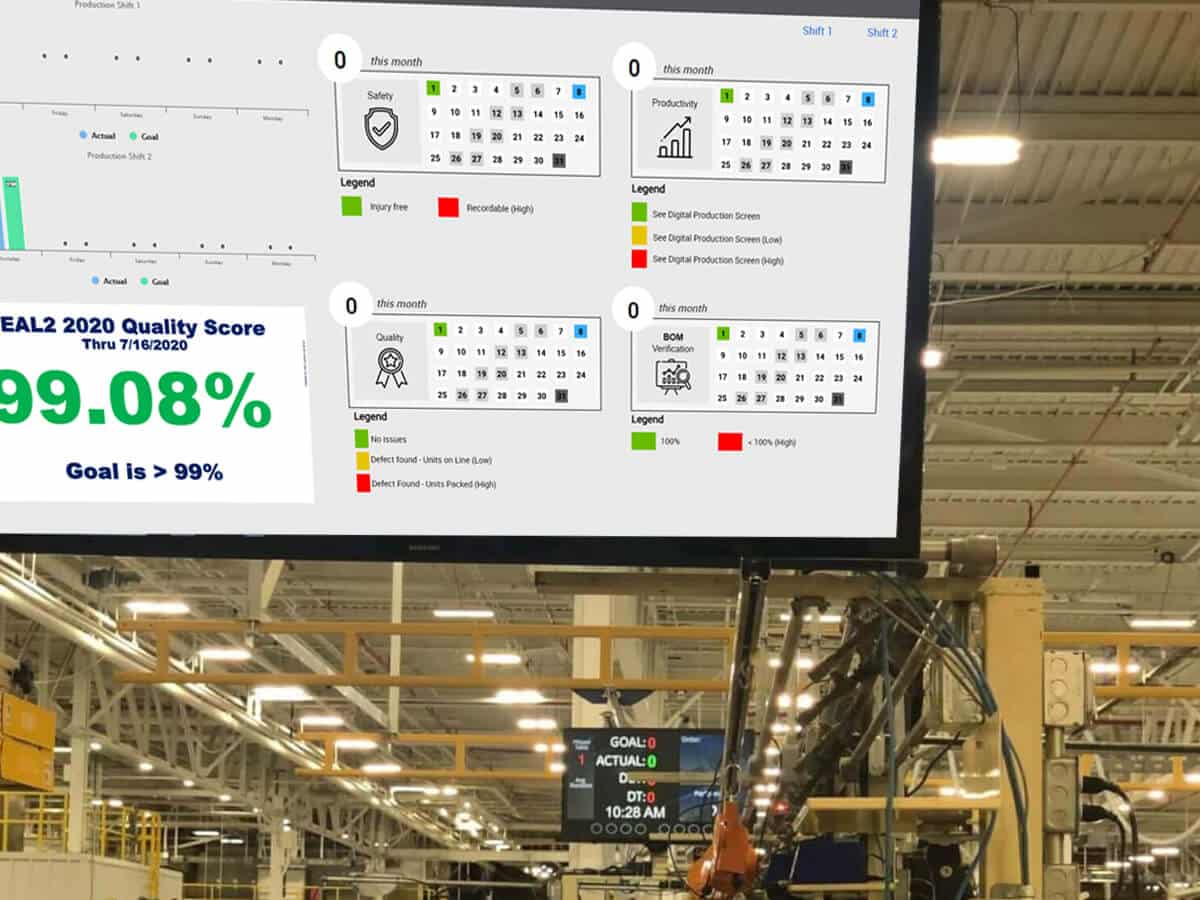
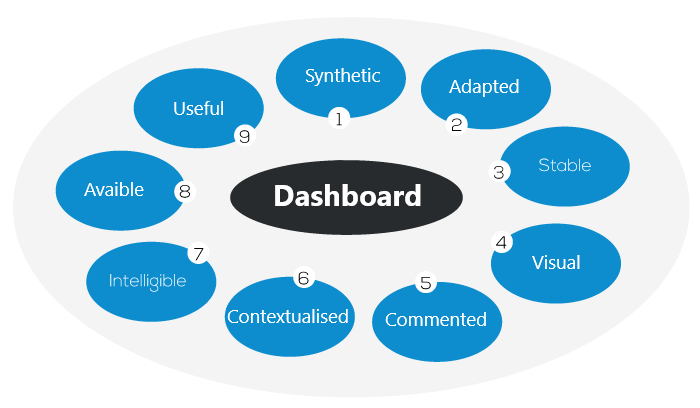
Visual management is based on the ability to reformulate the “raw” data of performance indicators into graphic elements (histogram, curve, gauge, etc..).
The advantage ?
- A more immediate understanding of the indicator
- A simplified perspective (for example via green-yellow-red color codes)
Digital visual management also makes it possible to display these indicators on a dynamic display panel, constantly updated, and “nourished” directly : by data extracted from your management software (ERP, MES, database, Google or Microsoft suites…) observations made during gemba walks.
You will therefore obtain both a saving in time (once designed, the panel updates automatically) and a precision gain (no error related to data entry by an operator): an animation panel visual digital allows you to make the most of this precious time that is the team animation ritual.
Gemba Walk
Gemba (the real place in Japanese, where things happen, that is to say at the shop floor): another concept popularized by Toyota, and which consists for managers to make tours in production units, to observe and ask questions to technicians for operational improvement.
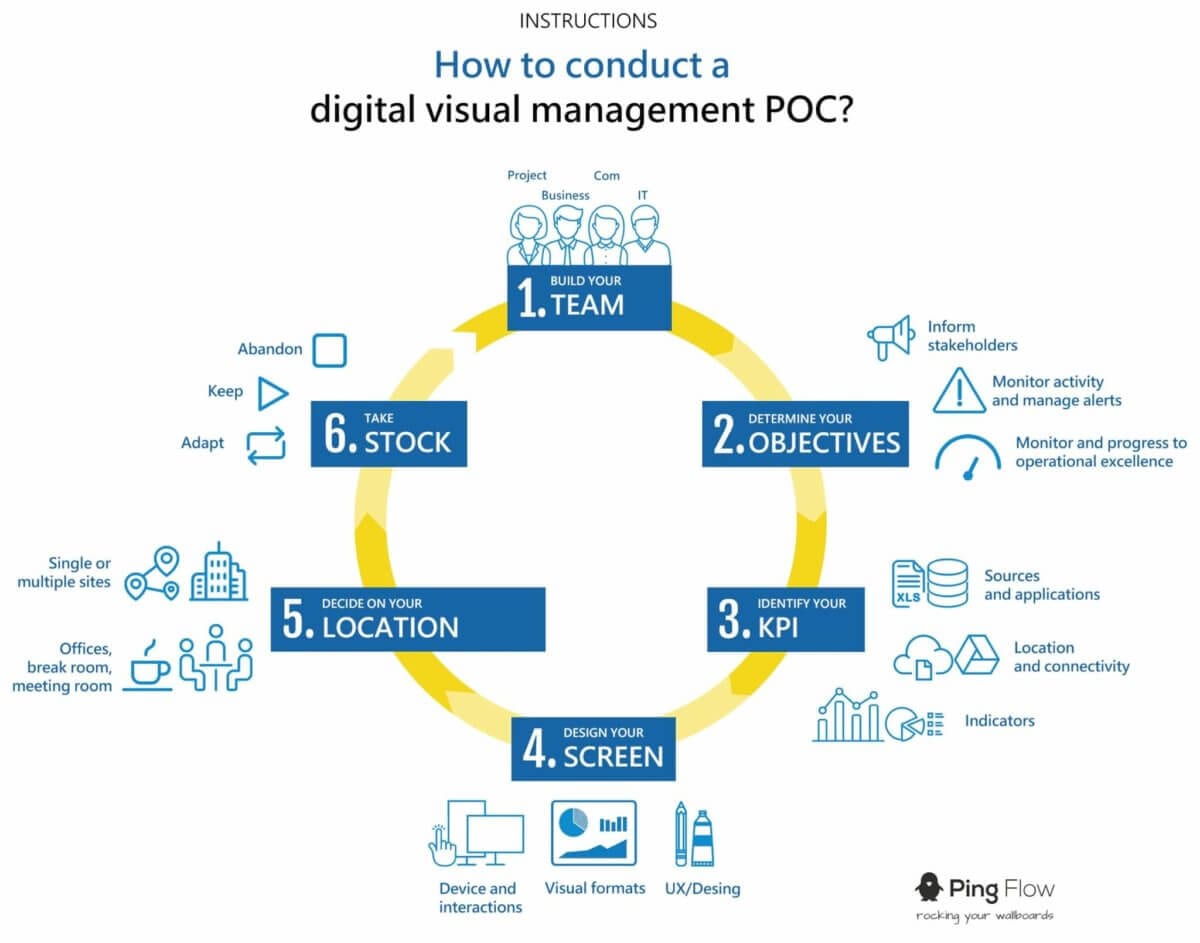
How to take advantage of digital visual management in your organization ?
Our showroom, in partnership with EliteOrga, consulting and training company allows you to concretely visualize how to digitize your team animations, production monitoring, supply chain. Make lean, digital transformation and performance work together !