
The fundamentals of a data-driven strategy
How can you master your data to better manage your business? Implementing a data-driven strategy involves several stages.

Data collection
from your business applications, your machines, feedback from field staff…

Data formatting
extract significant indicators, put them into perspective so that they make performance visible…

Data circulation
put them at the heart of the decision-making process and use them as a support for team leadership.
How do you create a "data culture"?
Without someone to analyze it, put it into perspective, and make decisions, data is nothing. Ensuring that your teams have access to the right data, and that they understand it, is the real key to the success of a data-driven strategy.
It’s a management issue that cuts across all corporate functions, rather than a technical one. How do you “acculturate” your employees to data? Make it visible and useful?
Pingflow makes data visual!
With Pingview (our solution for designing visual management wallboards for production), you connect or create your data sources, and design visual management media with impact.
These wallboards, which can be displayed on one or more large screens (in meeting rooms, workshops, etc.), enable you to translate your data into relevant, attractive and understandable indicators in real time.
Our examples of data-driven wallboards
Production monitoring
An adaptable shop floor management wallboard to light up your production data on displays directly on the shop floor and organize the communication of your data even more efficiently.
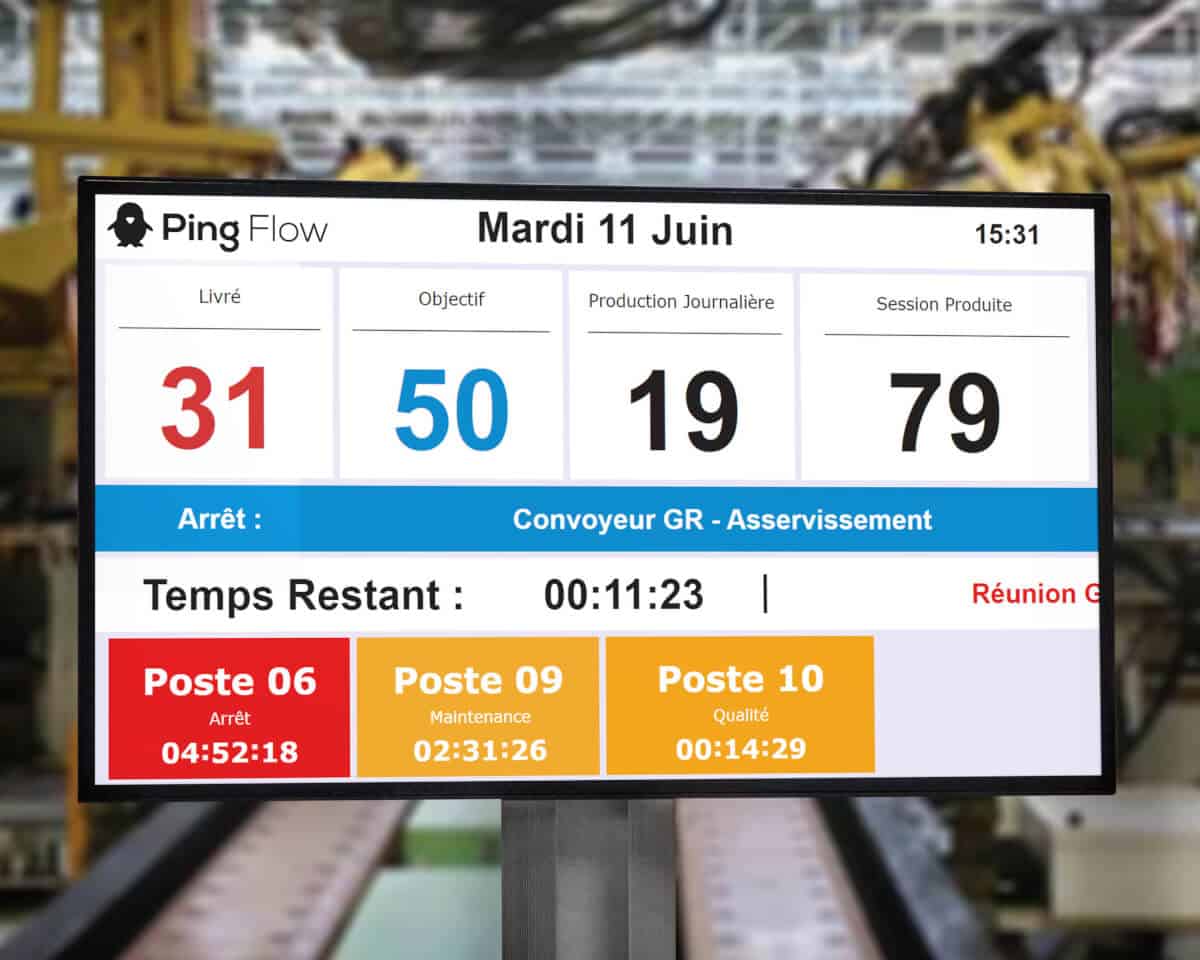
KPI & Andon Board
This wallboard gives a view of the entire production on different stations with a notion of remaining time.
Data + visual management: our solutions for capitalizing on your data

e-Andon
Andon lean: optimize your teams’ responsiveness to incidents
Real-time production control
Visual production management: optimize the performance of your workshops

Team rituals
Bring your animation rituals to life at short intervals with digital visual management

QHSE communication
Quality and safety management: pilot QHSE with our visual management software solution
They trust us
With Pingflow, our customers put their data in order, in the service of their teams’ performance. Here’s what they have to say.
The objective of visual management for ARaymond is to boost exchanges between managers and operators, to be more efficient by avoiding the time lost by managers to print and display, to facilitate the feedback of information by operators: problems, comments, continuous improvement

Groupe Atlantic wish to digitize the SIM (Short Interval Management) of the factory with very clear expectations: a system that simplifies and streamlines the production information and its visual “translation” into clear indicators, centralize and monitor the various action plans for the plant.
The Short Interval Management made digital on the wallboards focus on the current problems, and on the way in which we commit to solving them for continuous improvement and operational excellence
Tiag Industries has reached the milestone of factory 4.0 through the robotization of its extrusion fleet and the digitalization of workstation information.

Installation of wallboards connected to the “infflux” traceability software in logistics warehouses
A paper flowboard, a large synoptic spreadsheet schematizing the production lines, made it possible to follow the progress of each part during production, which each team leader would then “point” during the shift.
The challenge is to meet the information needs of Daher’s “frontline workers”, ie non-computerized people in the field, to disseminate business information in the field by reusing existing screens.

How to improve your production?
How to digitize physical visual management within 5 teams (pilot project)?
Let's talk !
Would you like more information? Have a demo? Or simply talk to our teams? Don’t hesitate to contact us!