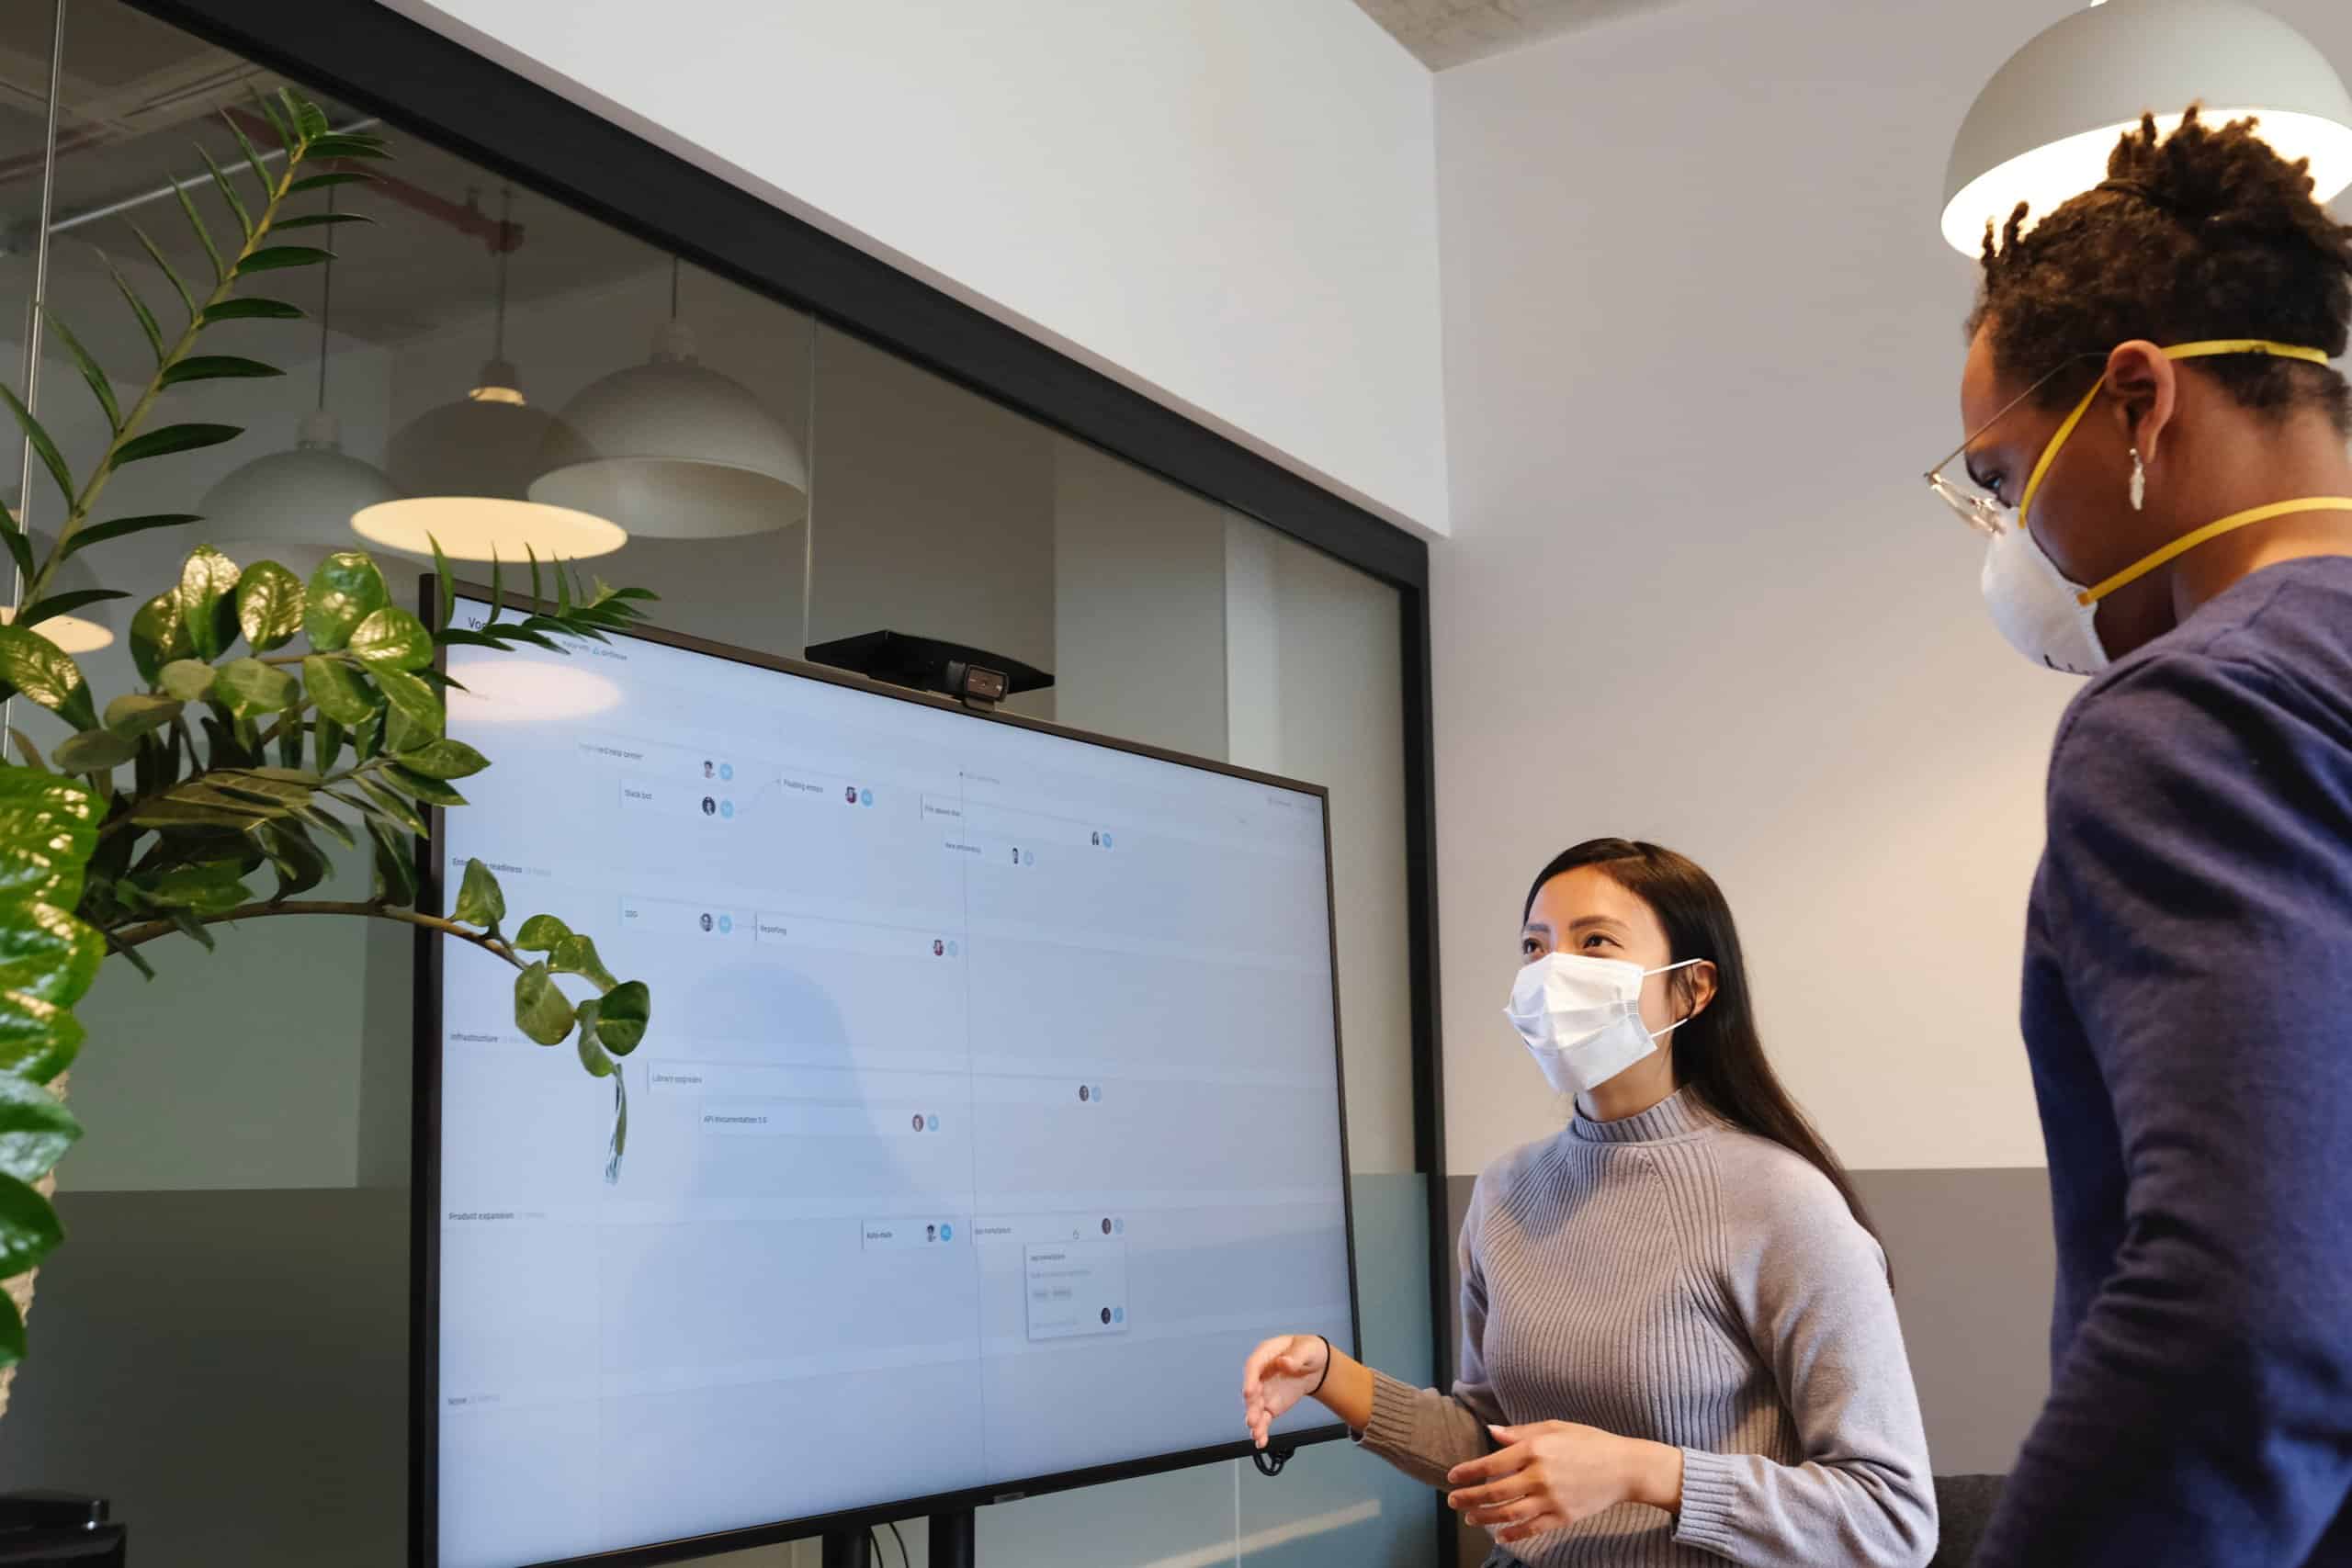
In large companies, and even more with the rise of hybrid-working, a good part of the resources of the IT / CIO services is devoted to the resolution of incidents: failures, bugs, or simply poor handling of software lead to problems requiring employees to enter multiple “tickets”.
Needs: measure, streamline, anticipate
For the business to run smoothly, and to reduce the stress inherent in these situations, these tickets must be taken care of and resolved as quickly as possible. In this context, the IT department functions a bit like an “internal customer service”, geared towards the satisfaction of employee-users.
The proper functioning of IT department and helpdesk therefore should :
- measure stress points in one’s activity to share a clear vision,
- streamline incident resolution, requests, questions …
- anticipate future incidents by identifying the most frequent or recurring ticket causes.
And in a broader perspective, for an IT manager, it is the opportunity to demonstrate the alignment of his service with business and professional challenges, strengthen the culture of management through performance, and enhance human capital and successes of its teams.
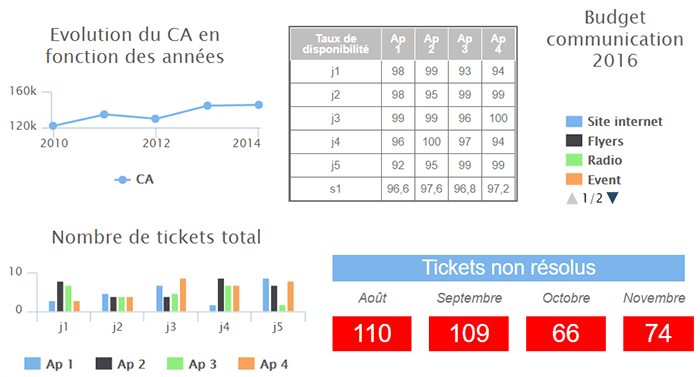
What indicators to monitor in an IT hotline?
More and more often, IT services (internalized as well as externalized) manage their service thanks to a service commitment contract or SLA (Service Level Agreement).
This SLA determines:
- the scope of the service (the outlines of the service promised to customers or internal users),
- the level of quality of this service on which the IT department commits.
To objectify this quality of service, an SLA will therefore define a certain number of indicators:
Volume :
- Number of tickets per unit of time (day, week, month)
- Comparisons and evolutions (vs D-1, S-1, M-1, A-1 …)
Velocity :
- Number of tickets solved per day, week, month
- Average ticket closing time
- User satisfaction rate
- Development and status of projects
Prioritization :
- Tickets by type of incident
- Ticket by emergency level
- Resolution rate and speed by type / urgency
Sources of incidents :
- Ticket volume per application
- Ticket volumes by issue (hardware, software, printing, etc.)
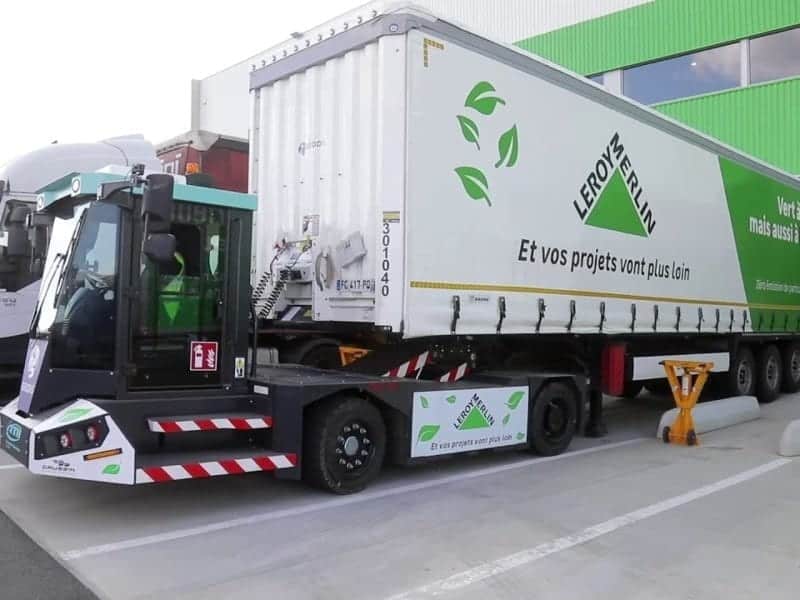
Leroy Merlin “unloads” IT and supply chain
 Teams understandably focus on their unique corporate culture and disparate IT architectures for various reasons. However, the fact is many business teams operate in silos while companies increasingly need collaboration and synchronization.
Thanks to PingFlow, Leroy Merlin was able to “break the silos” between supply chain and IT , by defining a certain number of KPIs (number of orders placed, number of orders processed, number of orders delivered, etc.), the exceeding of which triggers alerts automated on both the IT and supply side, and therefore the search for common causes and solutions.
Why switch to connected visual management ?
Helpdesk
Very often, the help desk or service desk of an IT department are equipped with an incident reporting management solution (ITSM) such as ServiceNow, Jira, Easyvista … These solutions allow the user to issue a ticket (support request), and IT to follow up and resolve the request.
A connected visual management solution will allow:
- to “look for the data” in the ITSM, but also in the other collaborative tools of the service (Trello or equivalent for project management, Google and Microsoft suites for reporting and analysis, etc.),
- to transcribe it into indicators (KPI) that are simple and readable by all.
Benefits ?
- precise information on activity in real time,
- early visibility into the potential causes of upcoming tickets (migrations, updates, etc.),
- better allocation of support resources and increased responsiveness,
- a “multi-service” view to anticipate,
- less time-consuming and more actionable reporting.
IDKids, efficiency gains in ticket management
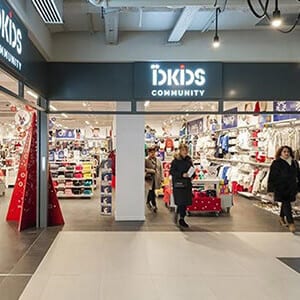
By interconnecting ServiceNow, the leading ITSM (information technology service management) solution, to PingView, the ready-to-wear and children’s toys group was able to bring together on a personalized animation panel all the information relating to its KPI. IT hotline, of its various releases into production… And thus they benefit from a gain of performance and better communication through the organization.
Learn more in the next article !
What visual management and indicators for efficient project management?