Agile methodology has become dominant in our daily lives, touching projects across organizations as they have changed how we think about project management. According to the 14th edition of the “State of Agile” survey, 95% of companies have adopted it for the conduct of their projects. From IT development and IT in the broad sense, from which this method originated, the practice extends more and more to management, marketing, human resources, sales teams, etc.
The reason ? Those who have adopted it observe that the agile method has many advantages.
Scrum
With 58% of companies using it (plus 18% of others using “hybrids”), Scrum is the most common approach of agile project teams. The concept “Sprints” (short development cycles of 4 weeks maximum), a very framed process with clear responsibilities, which allow a heavy project to be “split” into small, digestible advances, and maximize team productivity.
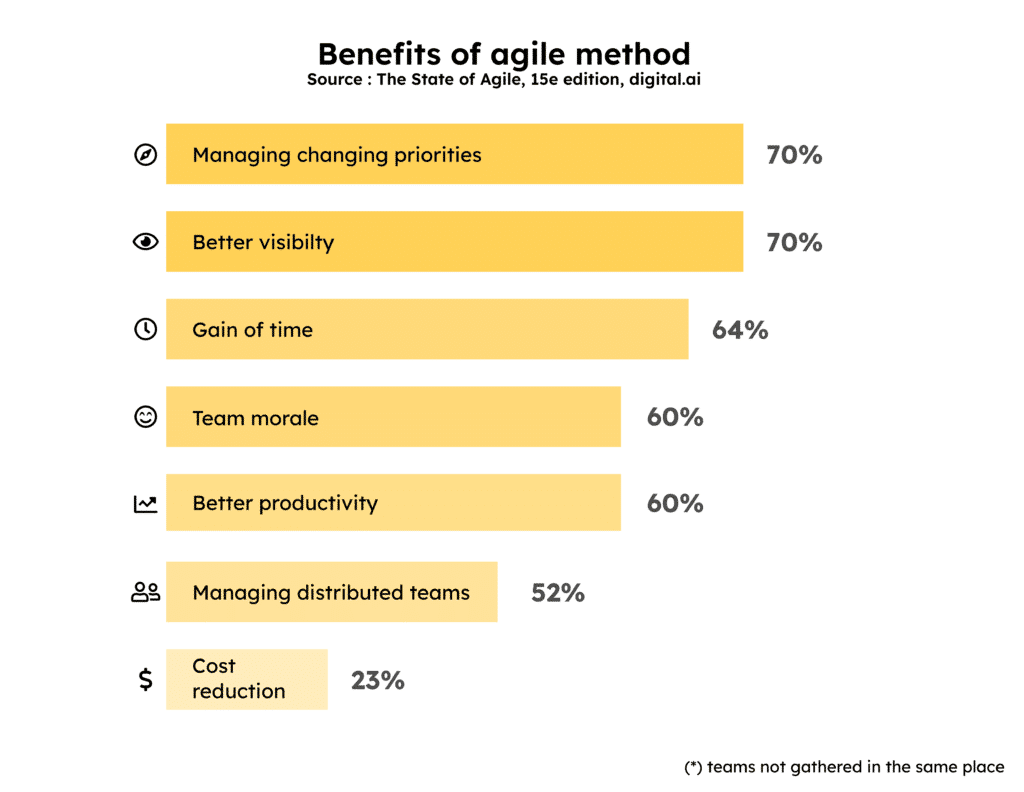
Due to their highly codified approach, agile methods give rise to a number of “measurement points”; in particular, when a “story”, sprint or project are completed. As such, there are plenty of potential indicators to facilitate project monitoring and optimize productivity. But you don’t have to be completely in agile mode to have measurable goals!
Project management KPIs
Team productivity :
- Team velocity (number of completed stories)
- Predictability (velocity compared to projected ideal rate)
Project progress :
- Burndown (amount of work remaining before the end of a sprint)
- Burnup (estimated completion date depending on progress)
Project quality :
- Coverage rate (portion of the deliverable tested before finalization)
- User satisfaction (NPS)
- Team satisfaction (mood board)
Reliability / delay :
- Lead time (time lapse between the issuance of a user requirement and the delivery of the project)
- Predictability (over time)
Visual management in project management : What contribution?
Daily standup, retrospective, sprint planning and sprint review… teams adept at lean and agile methods are fond of short, action-oriented meetings. So many occasions during which delivering easy-to-understand and clear information and indicators is a guarantee of efficiency: precisely what visual management is for!
More and more often dispersed (even remotely), these teams make extensive use of collaborative online solutions: Trello, Airtable, MS Teams, Slack, Asana, Notion, Miro… to brainstorm, communicate, document. These applications are part of of the standard toolbox of these teams.
This means that the data necessary for the production of the indicators mentioned above has already been digitized! And that it is readily available, most of these applications having developed an API. (Application Programming Interface) A visual management solution connected to this software will therefore be able to “pick up” the data at the source, and transcribe it in an interactive animation panel specially designed for the needs of the project team.
Obeya
Meaning “large room” in Japanese, the Obeya is the control room dedicated to the project team. This is where progress and productivity indicators are centralized, and where progress points are held. With the rise of remote and multidisciplinary teams, Obeya tends (as everywhere) to “virtualize”
Caisse d’épargne bank
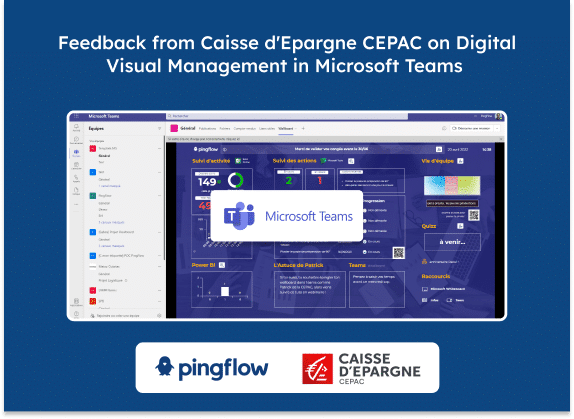
Based in France, more than 25 Caisse d’Épargne CEPAC teams use the wallboards co-constructed with PingFlow, with their own information and indicators. With lockdown in 2020, these users have exported screens otherwise installed in meeting rooms to Microsoft Teams. Thus allowing them to find an efficient collaborative space, even when working remotely. .