From A for AIC to Y for Yo-I-Don: all the definitions you need to know for industry 4.0 and lean management!
Kaizen, lean, AIC, andon, SQCD… in the industry, these words are well known, even if their definition is not always so clear. But datalake, API, no (or low) code? Coming from digital, these are part of the concepts to know in industry 4.0. To offer you clear and precise definitions of these different terms that are or will be part of your current professional language: this is the objective of this dictionary of lean, data and industry 4.0!
| A | B | C | D | E | F | G | H |
| I | J | K | L | M | N | O | P |
| Q | R | S | T | U | V | W | X Y Z |
– A –
Data aggregation
Data aggregation allows several pieces of information to be correlated to define (among other things) a key performance indicator (KPI).
API (application programming interface)
Allows two pieces of software to communicate with one another and share information automatically and securely. It can be used to launch processes and exchange data between different tools. It becomes reasonably easy to select data based on the requirements of business teams.
– B –
Big Data
The concept of Big Data became popular from around 2010. It is defined as a bulk set of unrelated data which can be sorted, stored, analysed and distributed.
Business Intelligence (BI)
Aggregation of data to support decision-making reporting. Is about making data intelligible, often using visual dashboards over a certain period and not in real time. BI (Business Intelligence) tools can aggregate large quantities of data, often with intense processing which requires perfect machine configurations and often long development time scales. These dashboards are often more appropriate for managers than for operators.
Collective intelligence
Have a collective performance greater than the sum of individual capacities. Gather around problems to find a solution for many: faster, more efficiently or more efficient. Digital can be a precious help to encourage collective intelligence.
– D –
Data driven
Is an approach to making strategic decisions based on the analysis and interpretation of data. In other words, examining and organising data to facilitate decision-making with an alignment between company strategy and the objectives of each business area and reinforces the flexibility needed to operate companies effectively.
Data driven company
By definition, all companies are data driven to some extent as they are governed by data. But today, a data driven company is one which exploits data to create value and aims for operational excellence.
Data lake
A data lake is a vast set of heterogeneous data, stored without prior structuring, often with a view to quickly and at controlled cost building up a data heritage to be used later. You can also find there:
- already structured data from business databases (from an ERP, a CRM, etc.),
- semi-structured data (from spreadsheets for example),
- unstructured data (emails, PDFs, etc.).
Data vizualization
Dataviz, Abbreviation of data visualization, the term designates the way of making visual (therefore visible) the encrypted information: by graphics, color codes, games of proportions, the dataviz makes it easier to understand and putting the indicators into perspective.
SEE ALSO > Business Intelligence, Visual Management
– F –
Flowboard
Unlike the dashboard, the flowboard aims to give an overview of the state at a given time of a process: on a production line with these different stations, a flowboard will show, for example, the number of units produced , in production, late, etc.
Frontline worker
In industry, frontline workers are production operators. In logistics, forklift operators, storekeepers, order pickers. In trade, sellers. Their common point? They are “in the field” and not in the offices, and therefore often lack permanent access to IT tools. In today’s companies, succeeding in informing and empowering frontline workers is becoming a key factor of competitiveness.
– G –
Gemba walk
Gemba, in Japanese, means “where the reality is”: a gemba walk (which could be translated as a field trip) therefore consists of a lean approach to visiting the workshop, the warehouse… in short, from there where the productive work takes place, to realize with an external eye the functioning, the points of improvement or blockage, etc. Systematized at regular intervals, the gemba walk is part of the panoply of essential lean tools.
– H –
Hoshin Kanri
The Hoshin method (meaning the right direction in Japanese), also called “management by breakthrough”, aims to translate strategy into objectives, and objectives into targeted actions aligned with the company’s vision.
– K –
Kaizen
Kaizen is a method of continuous improvement in small steps (it is the contraction of two terms which mean “change” and “better”). Developed in the 1950s originally in the field of quality, it has adapted to all professional contexts, and is based on a few major principles such as:
- proactivity and reactivity in solving problems: anticipate as much as possible, to be corrected as soon as the problem appears,
- the questioning of practices (even when they work) and the continuous analysis of the root causes of problems,
- employee involvement and collaborative decision-making, the search for efficiency, particularly financial.s, and
- objectives into targeted actions aligned with the company’s vision.
Kamishibai
A kamishibai panel makes it possible to control the progress of a process (quality controls, production line, etc.) broken down into a series of stages, materialized by cards: one side (red, most often) indicates that the stage or the task is not performed, the other (green) that it is and that the operator can therefore move on to the next one.
Kanban
Widely used in IT project management and software, the Kanban method aims to improve knowledge management and work organization, in the form of: columns, which represent the different stages of the workflow (from very simple like “to do”, “in progress”, “done” to much more complex) cards inside these columns that represent a specific task to be performed One of the advantages of Kanban is to easily visualize the current workflow, keeping control of the volume of work requested, without overloading the teams with information.
KPI
Key Performance Indicator. The KPI is always defined to meet a goal. It comes from a set of information that becomes consistent once aggregated.
– L –
Lean Management
Derived from the production system imagined at Toyota, lean management is a set of methods that aims to optimize processes: by tracking times or actions without added value (lean meaning “without superfluity”), by identifying and eliminating the causes of non-quality, reducing complexity as much as possible. It is based on strong managerial and employee involvement, and today applies to a large number of fields: IT, engineering, but also office.
Low code
Unlike the no-code solutions to which they are very similar, low-code solutions make it possible to create computer applications without programming skills, while retaining the possibilities of editing the source code to push customization one step further.
– M –
Muda
Waste (Muda in Japanese), as well as Muri (excess) and Mura (irregularity) are the three elements that we aim to minimize (or eliminate) in a lean approach.
Operational excellence
Operational excellence can be defined as the effective control and monitoring of processes to achieve given objectives. It is to have an organisation governed by fluid processes: The more fluid the processes the more efficient they are and the better the performance. In a wider sense, operational excellence is about bringing together the key success factors of a company:
- Satisfy the customer by anticipating their requirements,
- For teams to share a common vision,
- Place people at the centre of the process giving priority to trust, team working and training,
- Improve products and services while reducing waste,
- Involve partners in company strategy.
– N –
No code
A no-code computer application is an application that the user will be able to “program” without intervening on the source code, most often by means of:
- predefined “widgets”,
- a drag-and-drop editor
that allows you to assemble, link, and create conditions between the different widgets. No-code solutions, the use of which continues to grow, allow business teams to develop their own tools without calling on developers.
TO SEE> Low code
– O –
OKR
Objectives and Key Results consist of a series of broad strategic goals, often medium to long term, that serve to guide and analyze a company’s progress. They are then often broken down into initiatives (combined actions aimed at achieving an OKR) and KPIs (more “micro” indicators serving the achievement of the OKR).
OQD (on quality delivery)
The indicator that gives the number of units (OF, order lines, etc.) delivered “compliant”, without dispute with the customer. Generally expressed as a percentage, reduced to the total number of orders.
OTD (on time delivery)
The indicator of the number of units delivered on time, compared to the number of units produced.
– P –
PDCA (Plan Do Check Act)
Also known as the Deming wheel, the PDCA method designed by William Deming consists of 4 steps: plan:
- plan an experiment and the expected results
- do: implement the plan
- verify:validate (or not) the hypothesis
- act: if successful, normalize the results of the experiment and restart the sequence
POC (Proof of Concept)
A POC is a test “in real conditions” but on a small scale (restricted scope, deployment of limited functionalities) aimed at demonstrating the interest or the added value of an initiative before generalizing it. To do well a POC must be framed in time, with expectations specified upstream.
– Q –
QRQC (Quick Response Quality Control)
Pragmatic and involving the operators as their hierarchy, the QRQC method aims for a rapid resolution of problems (defects, non-conformities) starting from the field.
– S –
Shift
A shift (or shift) is the working period of a team in shift work: according to needs, manufacturers organize their production in shifts of “two eights” (two teams follow each other over 16 hours of total time) , three shifts (three shifts, over 24 hours)… up to “five shifts” (the factory operates 24 hours a day, 7 days a week with rest shifts for the shifts).
Structured data
Also called structured information, this is data organised around themes. Data are always updated in the same way. For example, an email address is structured data because it always takes the same format.
Unstructured data
Unstructured data is information where the format is defined in different ways and may or may not contain certain fields. It can also represent information from paper, whiteboard , various files that are not “digitally exploitable”. For example, an API may request information on tickets: one with title and description fields whereas for another, only the title field is available. Another example would be the excel file with different standards in cells : “,” ; “.”
SIM Short Interval Management
SIM are animation rituals (in other words meetings) very used to manage a team (in production unit, in logistics, but also in office): periodic, with a short interval between each meeting (they are organized daily or at the start of a shift, for example, in a factory), short-term (from 5 minutes at team level to 1 hour at management level), with an almost immutable agenda, dictated by the review of the relevant indicators (SQCD for example in an industrial context), which are updated just before the start of the SIM.
– T –
Takt time
Not to be confused with the actual duration of your production cycle, the takt time is the time interval that you must respect to meet the demand of your customers. It is obtained by a very simple formula: takt time = available working time / order volume.
Visual management
Method to visualize KPIs and key information related to the activity of a team: see where the elements are throughout the chain, flow and process. There are several forms of visual management:
- performance Visual management: visual management of KPIs, highlighting of results and display of problems
- activities Visual management of : task management, sharing of information in open space
- project Visual management: visibility of all company projects (steering, monitoring, resources, etc.)
- flows Visual management : visualization of the value chain, lead-time analysis, management of logistics flows, etc.
– W –
 Wallboard
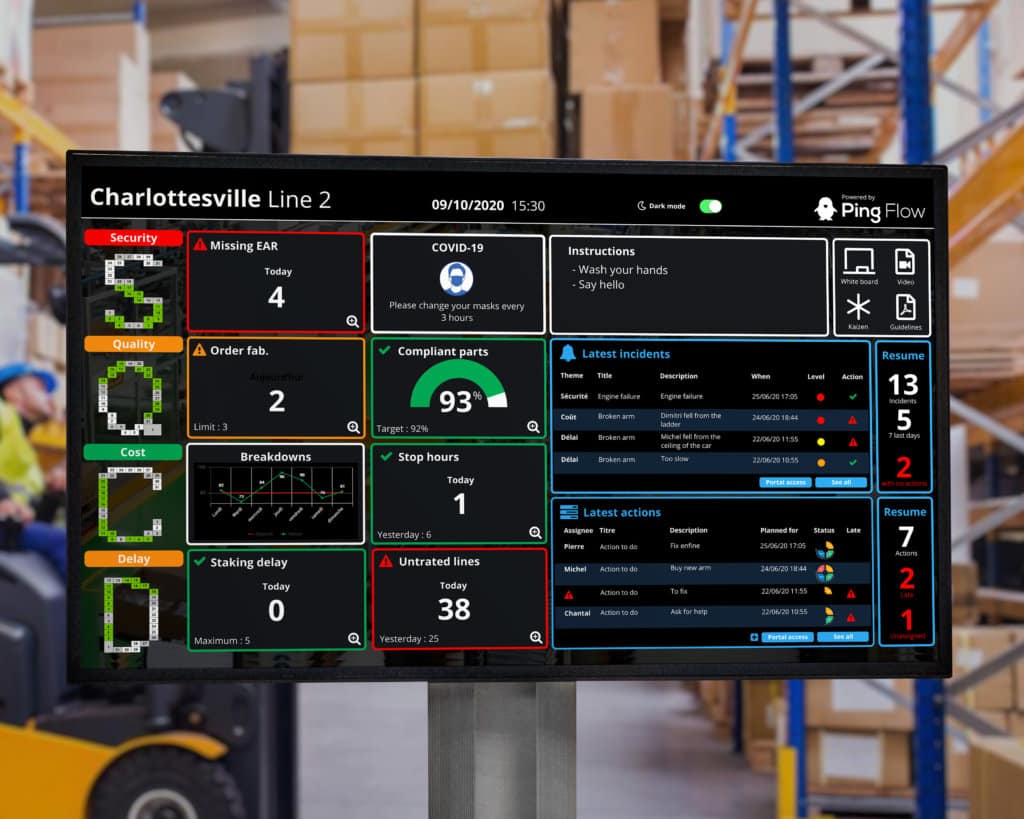 Wallboard
Consisting of a set of indicators (KPI), a wallboard is intended to be displayed on a large screen: designed for the information and the animation of the teams (which distinguishes it from the dashboard, for rather individual use and on computer screen), following the principles of visual management (simplicity and clarity of data), with a global vision (multi-thematic, structured and aggregated multiple data sources), connected to business applications to have up-to-date data in real time.
Web service
In the same way that an API serves as a “dialogue” interface between two computer applications, a Web Service allows two remote machines to interact via: a Web Service Description Language (WSDL), a “common language” (a format that can be processed by the machines concerned), a communication protocol (often HTTP, but also SOAP, REST, or XML-RPC sometimes).
– X Y Z –
Yo-I-Don
Another element from Toyotism, Yo-I-Don (“on your marks, get set, go”) is a method that allows you to quickly overcome bottlenecks: on a workstation in a production line, a system of red and green lights allows the operator to indicate whether his task is completed or not. If a red light is on, the line is stopped, the time that the operators come to help their colleague to finalize his task to restart production.
Obviously, this list is not exhaustive but allows you to better understand these different terms and to be able to communicate them to your teams to support them in your data-driven culture process.