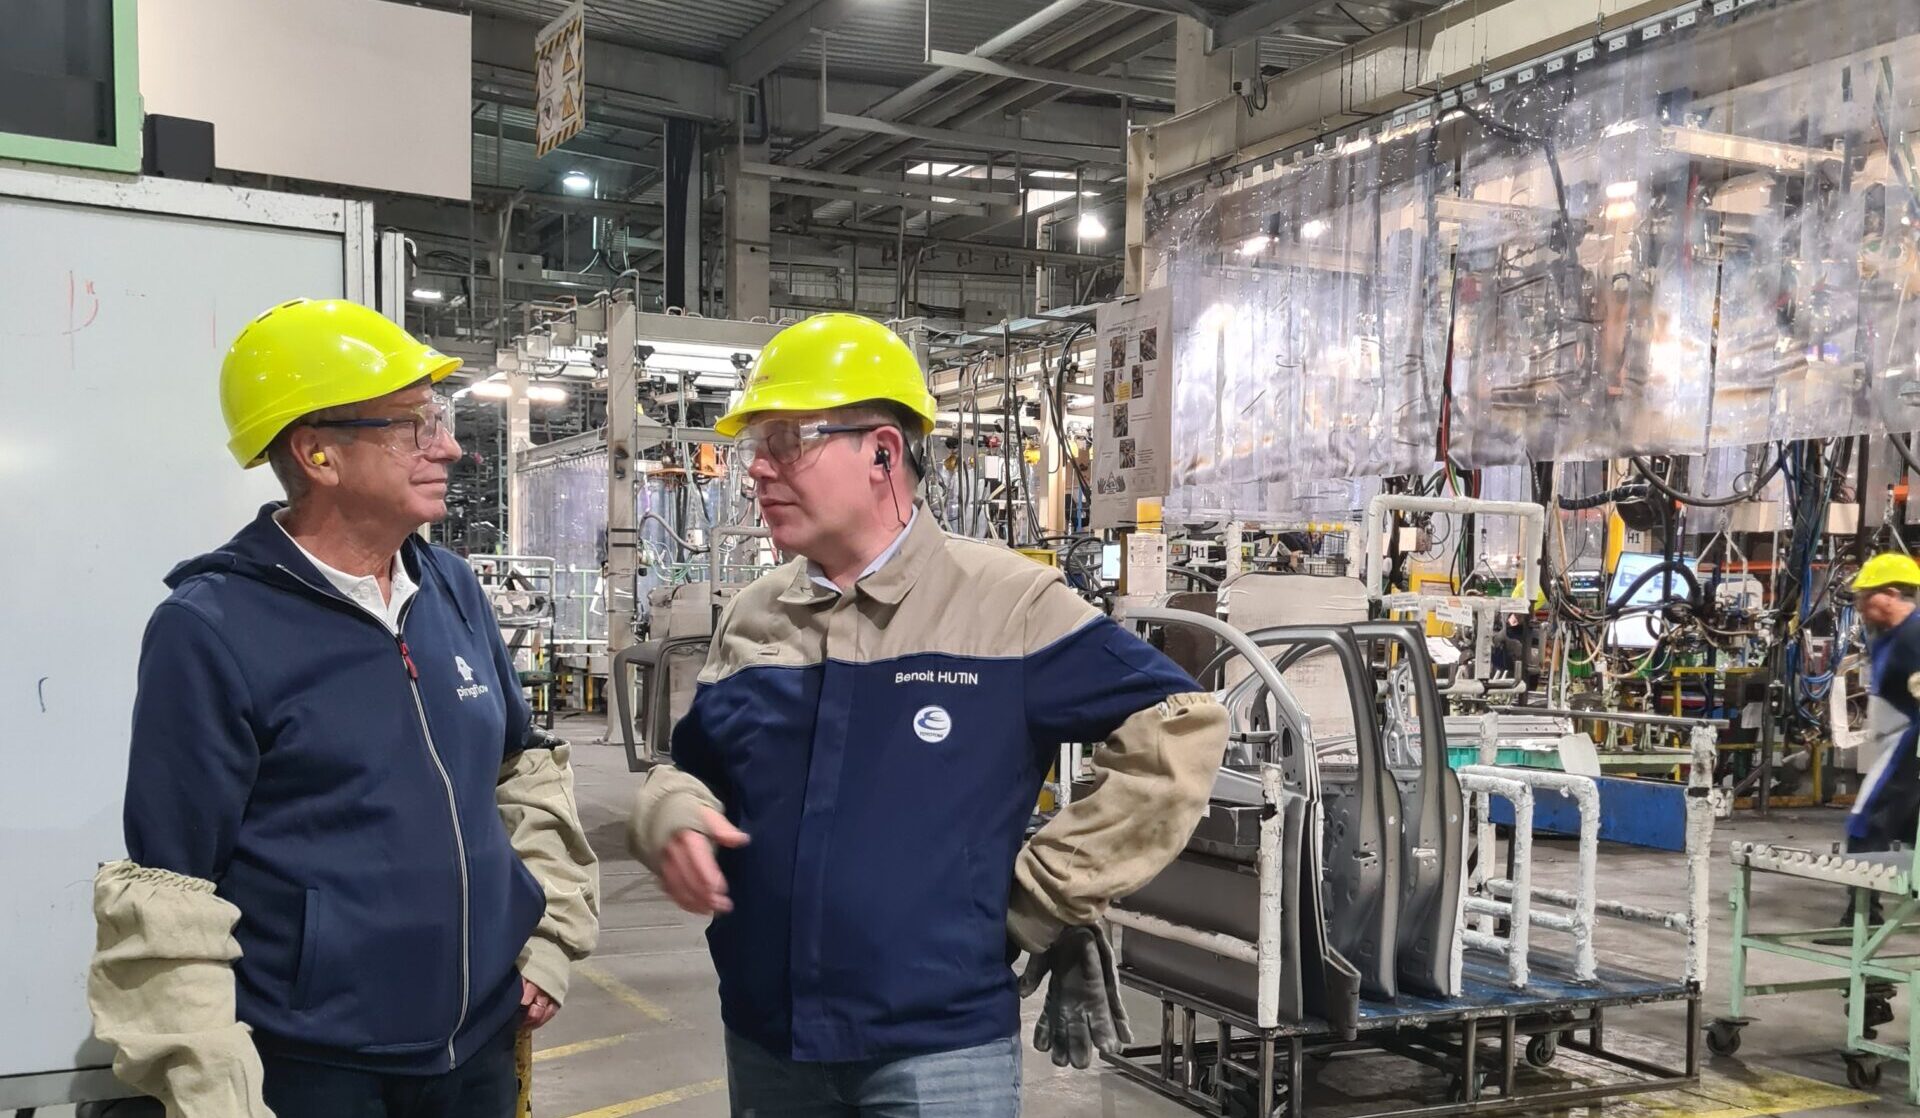
How Toyotomi Reduced Production Downtime by 20% with Digital Andon

🕐 Temps de lecture : 5 minutes

From Next-Day Reporting to Real-Time Performance Management: A Key Challenge for Manufacturers

There are two ways to manage a factory: the first is to review what has happened, while the second is to see what is happening. In the first case, results are analyzed at the end of a shift, at the end of the day, or sometimes the following day. Teams explain, justify, and correct issues… after the fact. In the second, they take action as events unfold.

This is the subtle yet decisive transformation undertaken by Toyotomi Europe, an automotive supplier based in Valenciennes, France. Despite having a well-structured organization and experienced teams, one challenge remained: operational performance management still relied partly on data consolidated after the fact.

The result: performance deviations detected too late, limited responsiveness, and difficulties taking effective action on the shop floor.

By implementing a digital Andon system, the company gradually shifted its approach: moving from delayed performance reporting to real-time performance management, delivering tangible improvements in operational performance and organization.

Toyotomi Europe: A Manufacturing Plant Where Responsiveness Is Critical

Toyotomi
Toyotomi Europe
Automotive supplier, subsidiary of a Japanese group
🚗 Automotive Industry
Business Activity
Manufacturing automotive structural components (stamping, welding, and assembly)
Company Profile
Manufacturing plant with 350 employees, based in Valenciennes since 2005, and part of an international group
Key Challenges
Improve responsiveness and production management through real-time access to operational data
Project with Pingflow
Implementation of a digital Andon system to make data visible, accessible, and actionable on the shop floor
Toyotomi Manufacturing Plant

The plant manufactures structural components for the automotive industry, particularly for Toyota, supplying parts for up to 1,700 vehicles per day.

Its operations involve several manufacturing processes (stamping, welding, and assembly), with tightly synchronized and interconnected production flows. In this type of environment, every disruption has a direct impact on production.

The ability to quickly detect problems and mobilize the right resources is therefore a key driver of operational performance.

Illustration représentant un pingouin tenant une loupe

A Shared Challenge: Limited Operational Visibility

When Benoît Hutin joined the company as Production Manager, he quickly identified a major challenge: the gap between what was happening on the shop floor and the data available to manage operations.

Some information was only available the following day (D+1), through manual data consolidation or updates from shop floor teams. This resulted in:

  • Reactive rather than proactive performance management
  • Decisions made without a complete picture of the situation
  • Difficulty identifying the root causes of performance deviations

In other words, the teams did not lack data. They lacked actionable data at the right time.

How the Japanese Model Inspired a Change in Mindset

As part of his onboarding, Benoît Hutin traveled to Japan to spend time within the group. This experience proved to be an eye-opener.

Photo chez Toyotomi Kiko au japon

CWhat impressed him most was not the technology itself, but the discipline behind daily operations:

  • Strict adherence to standards
  • Immediate response to deviations
  • Direct involvement of operators in problem-solving

In this model, handling abnormalities follows a simple principle: a problem must be immediately visible and addressed without delay.

This approach contrasts with certain practices observed in Europe, where teams may sometimes work around established standards or address problems after the fact.

This difference highlighted a major opportunity for improvement: strengthening real-time visibility to enable faster, more effective action.

Digital Andon: Enabling Real-Time Production Management

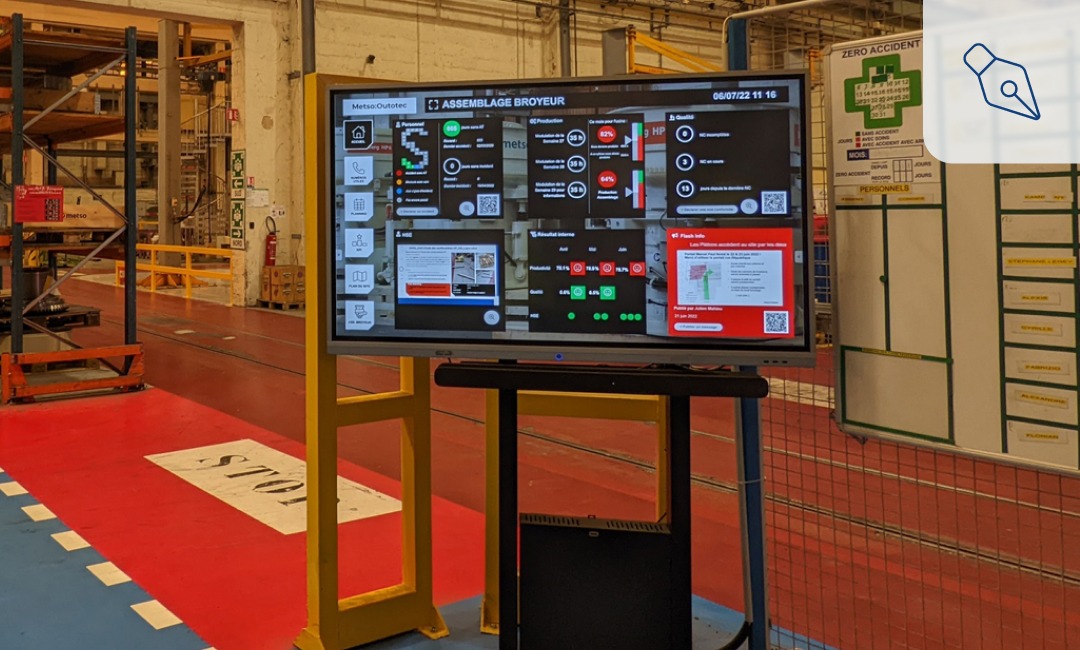
Photo de l'andon legacy chez toyotomi

At Toyotomi, a digital Andon system had already been in place for several years in partnership with Pingflow. Its use gradually expanded to support and structure daily production management.

In practical terms, the system enables teams to:

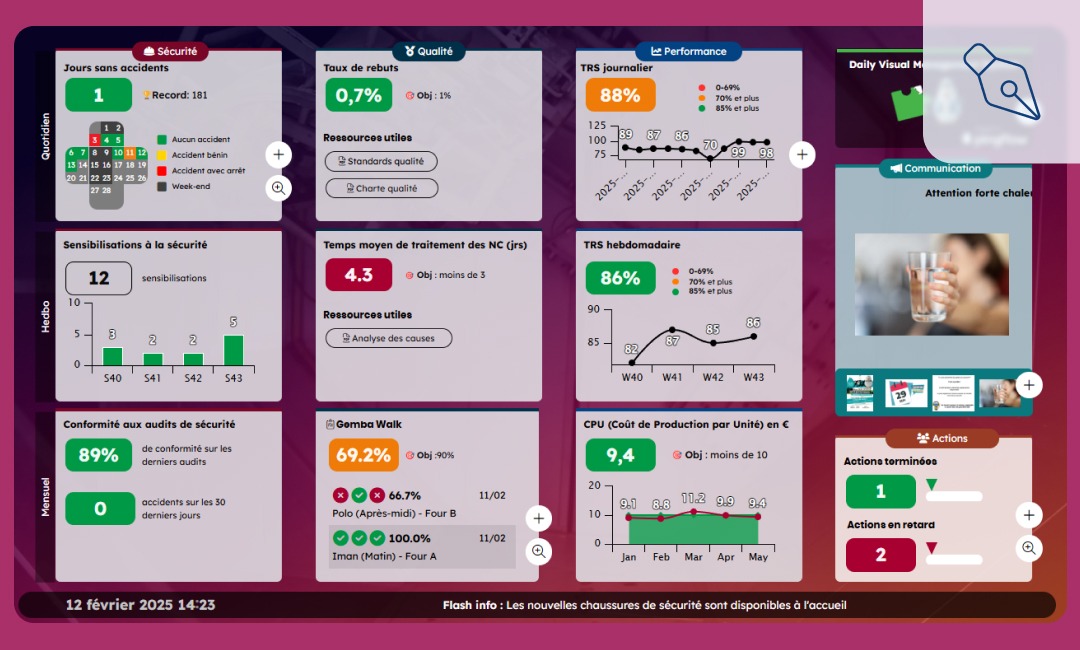
  • Monitor production progress in real time
  • Visualize performance deviations (ahead of schedule, delays, incidents)
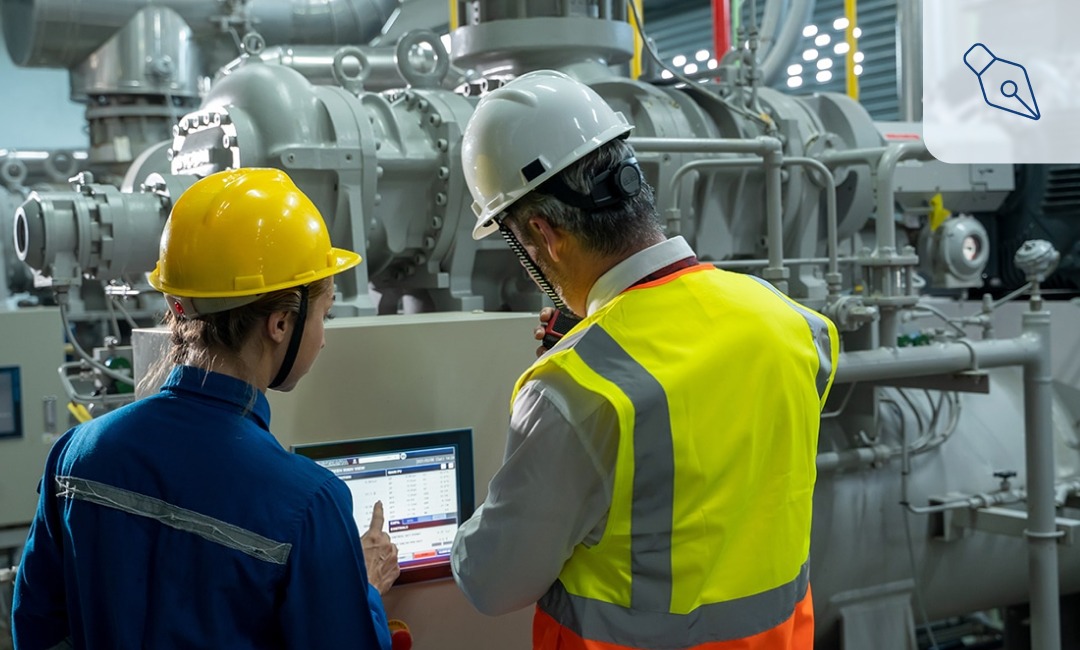
  • Trigger alerts directly from workstations
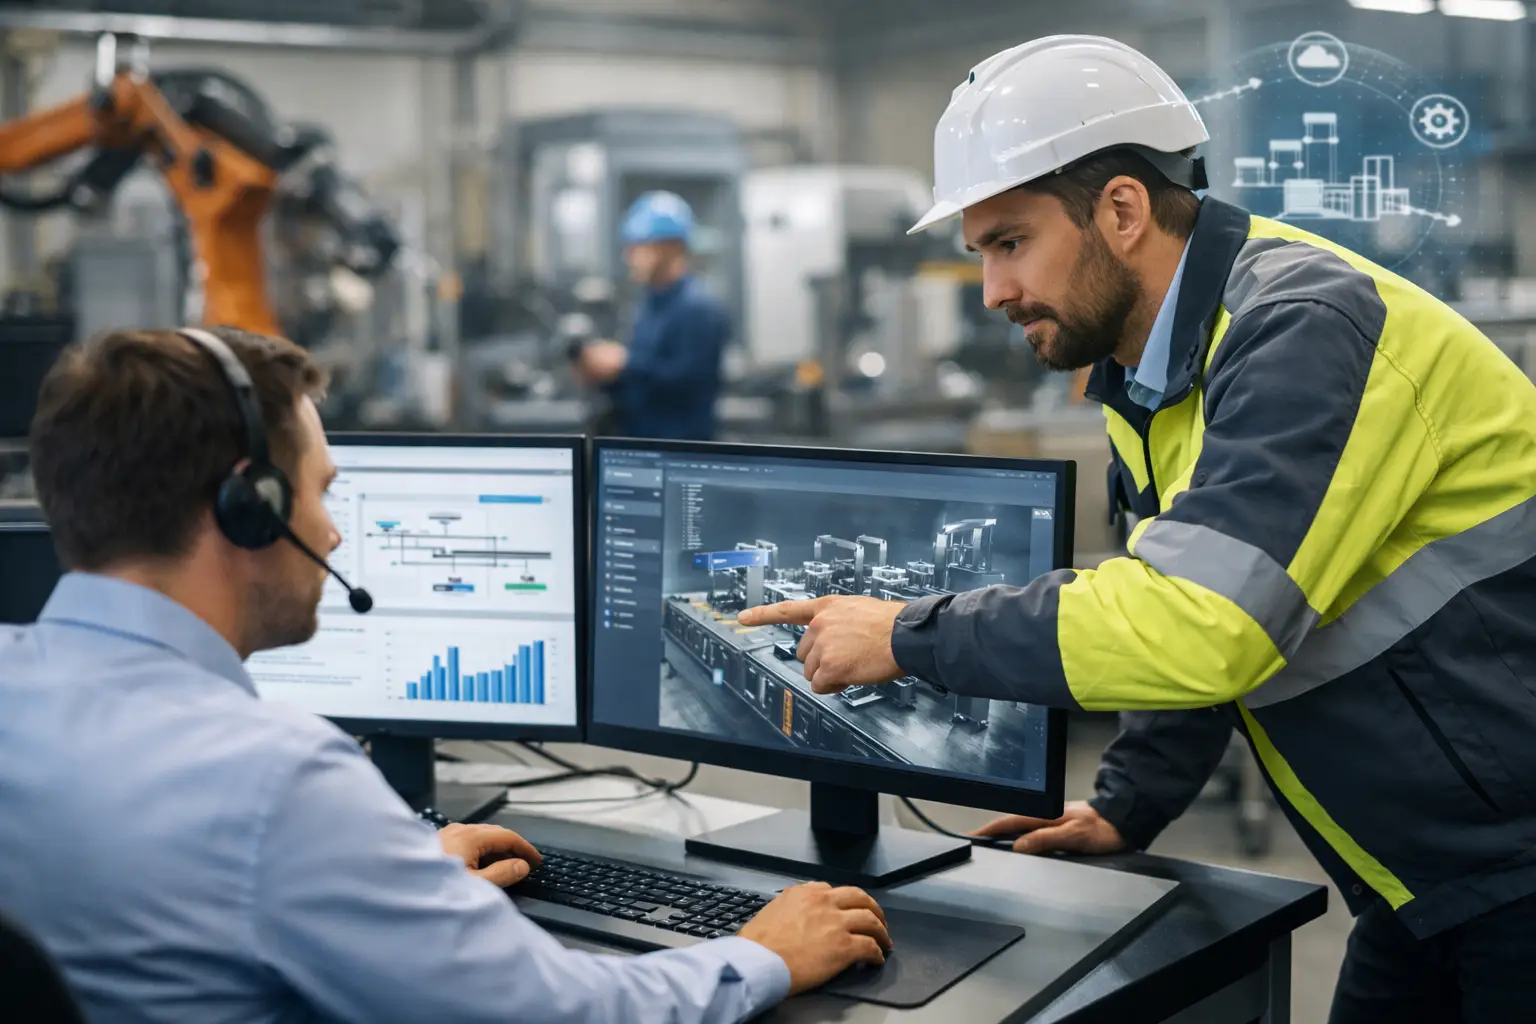
  • Quickly coordinate interventions by team leaders and maintenance teams

Information is displayed across multiple devices, including shop floor screens, computers, and smartphones.

This is essential: data is not simply collected. It is made visible and accessible at every level of the organization.

Results Achieved

Rapid Improvements in Performance and Team Coordination

-20 %
reduction in production downtime thanks to faster incident response

What Made These Improvements Possible

  • Operators can immediately report problems.
  • Teams no longer need to spend time searching for information.
  • Interventions are faster and more targeted.

How This Transforms Daily Operations

  • Communication between teams becomes more fact-based.
  • Priorities are clarified in real time.
  • Operational decisions are increasingly driven by data rather than assumptions.
The system quickly becomes essential to daily operations. Even a temporary interruption can significantly disrupt workflows, demonstrating how deeply it has become embedded in everyday practices.

From Visibility to Analysis: Making the Most of Shop Floor Data

UOnce real-time visibility is established, a second challenge emerges: turning collected data into actionable insights.

The Andon system captures a large volume of operational data, including:

  • Technical incidents
  • Operator assistance requests
  • Variations in production rates

This data provides a valuable opportunity to identify and analyze recurring causes of poor performance.

The goal is not only to address major incidents but also to identify minor disruptions such as:

  • Stoppages lasting just a few seconds
  • Inefficient movements or processes
  • Everyday operational inefficiencies

Individually, these issues may seem insignificant. However, when combined, they can account for a substantial share of production losses.

Integrating analytics tools, such as Business Intelligence (BI) solutions, enables manufacturers to move beyond reactive performance management toward a structured approach to continuous improvement.

A Central Challenge: Management and a Shift in Mindset

While implementing a digital tool is relatively straightforward, successful adoption depends primarily on management practices.

photo andon chez toyotomi

At Toyotomi, the main challenge was not technical, but cultural.

Moving toward data-driven performance management means moving beyond intuition, being willing to challenge established habits, and adopting a structured approach to problem analysis.

It also requires supporting employees through the transition, as not everyone adapts in the same way. Some quickly embrace an analytical mindset, while others need additional training and guidance.

Management therefore plays a decisive role in ensuring these new practices become firmly embedded in daily operations.

Putting Shop Floor Teams at the Heart of Continuous Improvement

One of the key lessons from this transformation is the importance of frontline operators.

At Toyotomi, several initiatives have been introduced to increase their involvement:

  • Workstation analysis
  • Discussions and knowledge sharing between operators
  • Identification of everyday operational challenges

These initiatives have helped uncover practical improvement opportunities, often overlooked by managers.

This is a crucial point: operational performance depends not only on tools and data, but also on the ability to listen to frontline teams and leverage their expertise.

arche de securite hse chez toyotomi

Toward a Lasting Transformation of Manufacturing Practices

Today, Toyotomi continues to expand the use of its tools and methodologies through:

  • Extending the Andon system to other operational areas
  • Developing dashboards and advanced analytics
  • Introducing digital daily management routines

But beyond the technology, a deeper transformation is underway.

The shift to real-time performance management goes far beyond immediate operational improvements. It fundamentally changes how teams work, collaborate, and make decisions.

Conclusion: Real-Time Visibility for More Effective Action

Toyotomi's experience highlights a crucial lesson for manufacturers: performance depends not only on the ability to produce, but also on the ability to see, understand, and act quickly.

Digital Andon plays a key role in this transformation:

  • It makes problems visible
  • It accelerates decision-making
  • It aligns teams around a shared understanding of operational reality

By shifting from delayed reporting to real-time performance management, Toyotomi has achieved more than just improvements in its performance indicators.

The company has laid the foundation for a more responsive, data-driven organization with a stronger focus on continuous improvement.

Pour aller plus loin...

Explorez tous nos articles pour découvrir des cas concrets et obtenir des conseils pratiques pour digitaliser votre site industriel.

Illustration d'un pingouin qui dit "celui-ci est particulièrement intéressant !"
Exemples de KPI Tree Industriel

KPI Tree industriel : comment structurer vos indicateurs pour piloter réellement la performance

📊 Un constat fréquent en industrie Votre usine suit peut-être 80 KPI. Pourtant, si l'on vous demande lesquels expliquent réellement une baisse du TRS, la réponse prendra sans doute plusieurs minutes. Ce n'est pas un problème de données. C'est un...
Opérateur montrant un écran ERP ou MES à quelqu'un du bureau

Guide intégration ERP MES terrain : réussir la connexion entre les systèmes et les équipes

Sur le terrain, l'échec d'une intégration ERP-MES ne vient presque jamais du connecteur. Il apparaît généralement plusieurs semaines après la mise en service, lorsqu'un responsable de production découvre que les données remontent correctement dans...
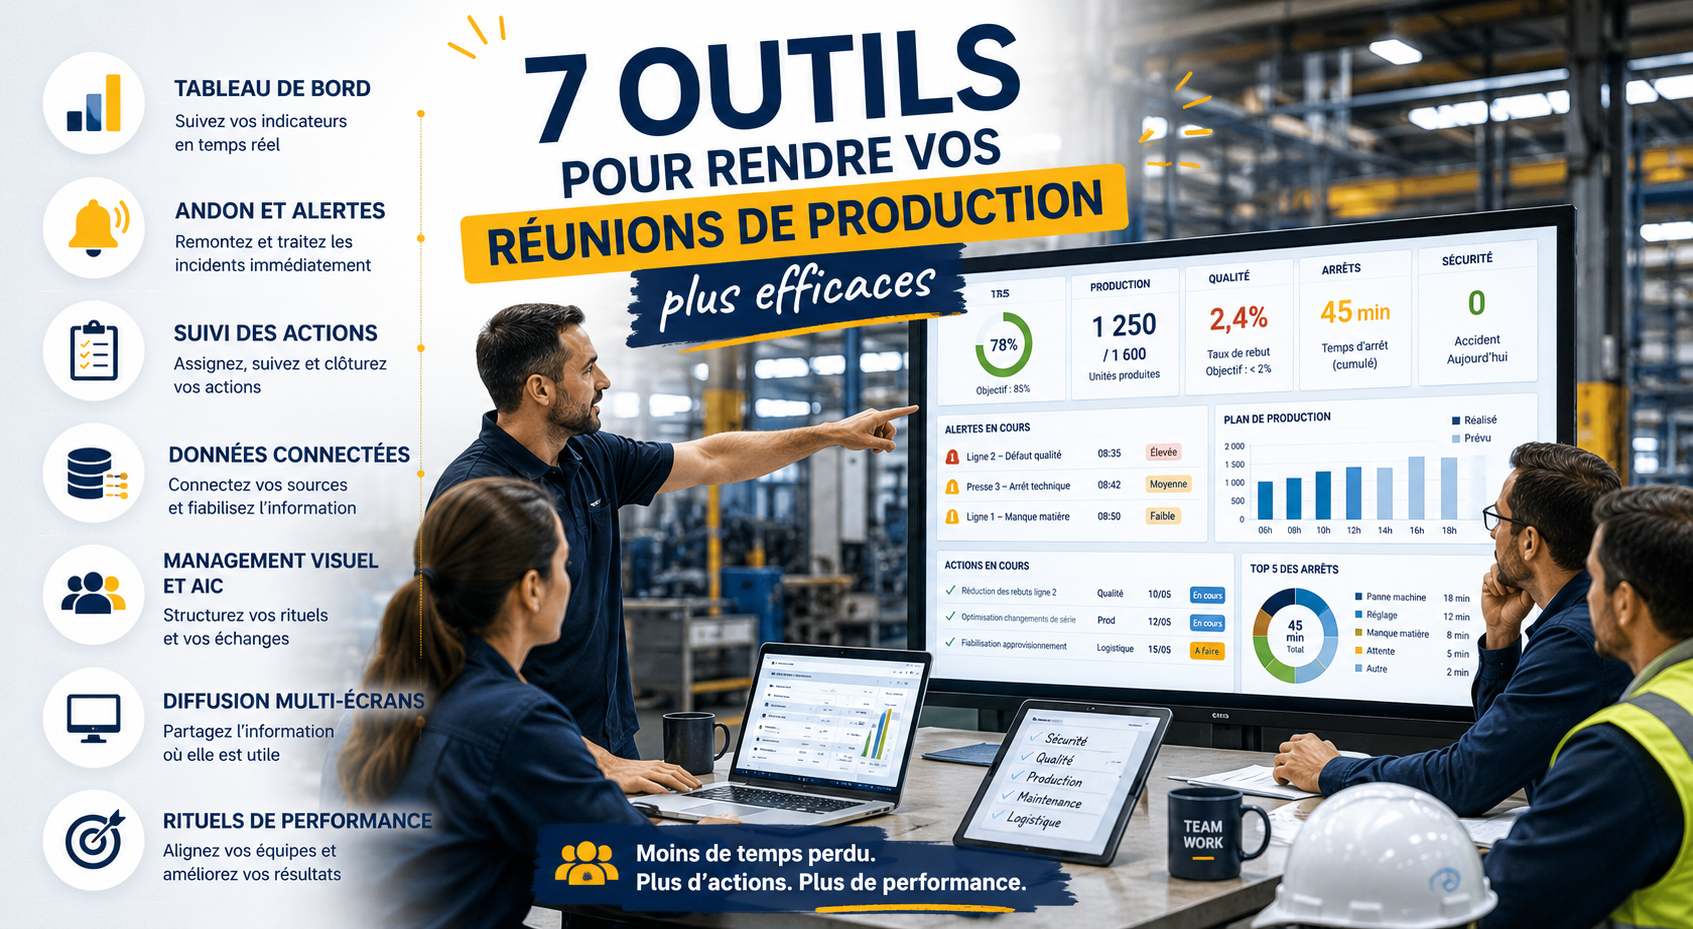
Réunion de production industrielle avec tableau de bord en temps réel et outils de management visuel digital. L'image présente les principaux outils pour réunions de production efficaces : Andon, suivi des actions, données connectées, AIC, diffusion multi-écrans et pilotage de la performance en usine.

7 outils pour rendre vos réunions de production réellement efficaces

ChapitragePourquoi les réunions de production déraillent encoreLes 7 outilsQuels indicateurs suivre pendant une réunion de production ?Les erreurs les plus fréquentesCe qu'une bonne réunion doit produire À 9 h 02, la réunion de production a déjà...
Personnes devant un écran montrant un logiciel de pilotage visuel

Logiciel de pilotage visuel en usine : comment choisir une solution utile au terrain

À 8h05, le point d’équipe commence.Le tableau blanc n’est pas à jour, les chiffres de la veille circulent encore sur un fichier Excel, et l’alerte qualité de nuit n’a pas été remontée au bon niveau. Résultat : les équipes passent les dix premières...
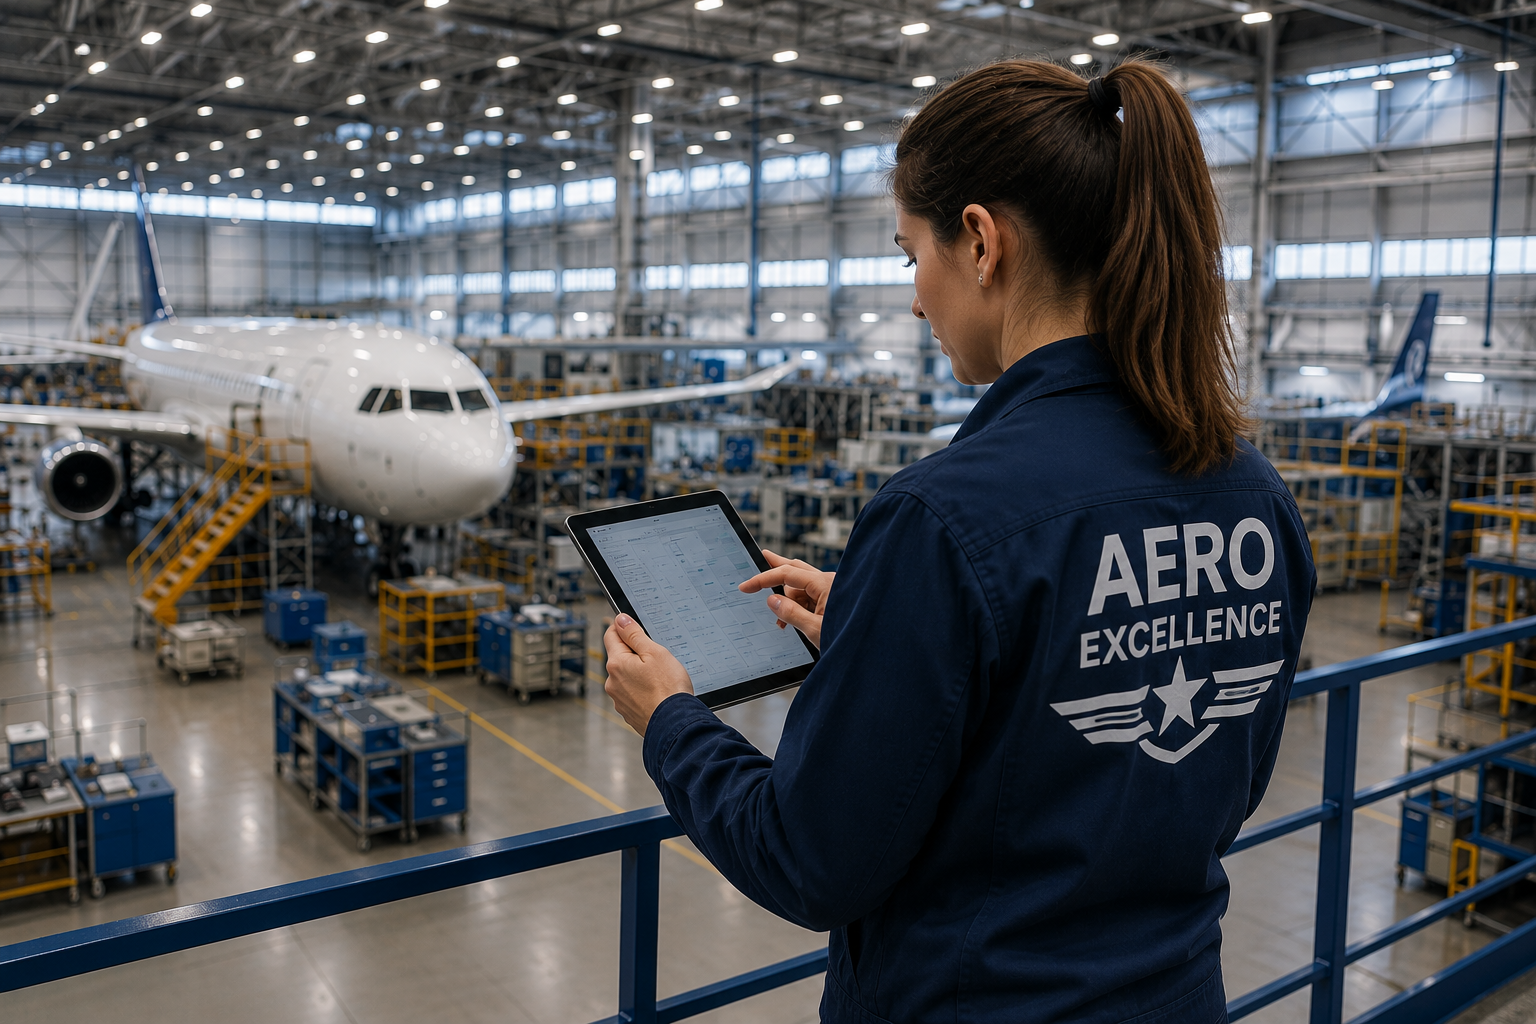
Une femme dans un atelier devant un avion avec une tablette à la main suivant les andons

Comment réduire les temps de réaction pour Aero Excellence avec l’Andon

ChapitragePourquoi Aero Excellence pousse les industriels vers une logique de réaction rapidePourquoi les systèmes Andon traditionnels atteignent leurs limitesL’e-Andon transforme l’incident en donnée pilotableLe MTTR devient un indicateur clé de...
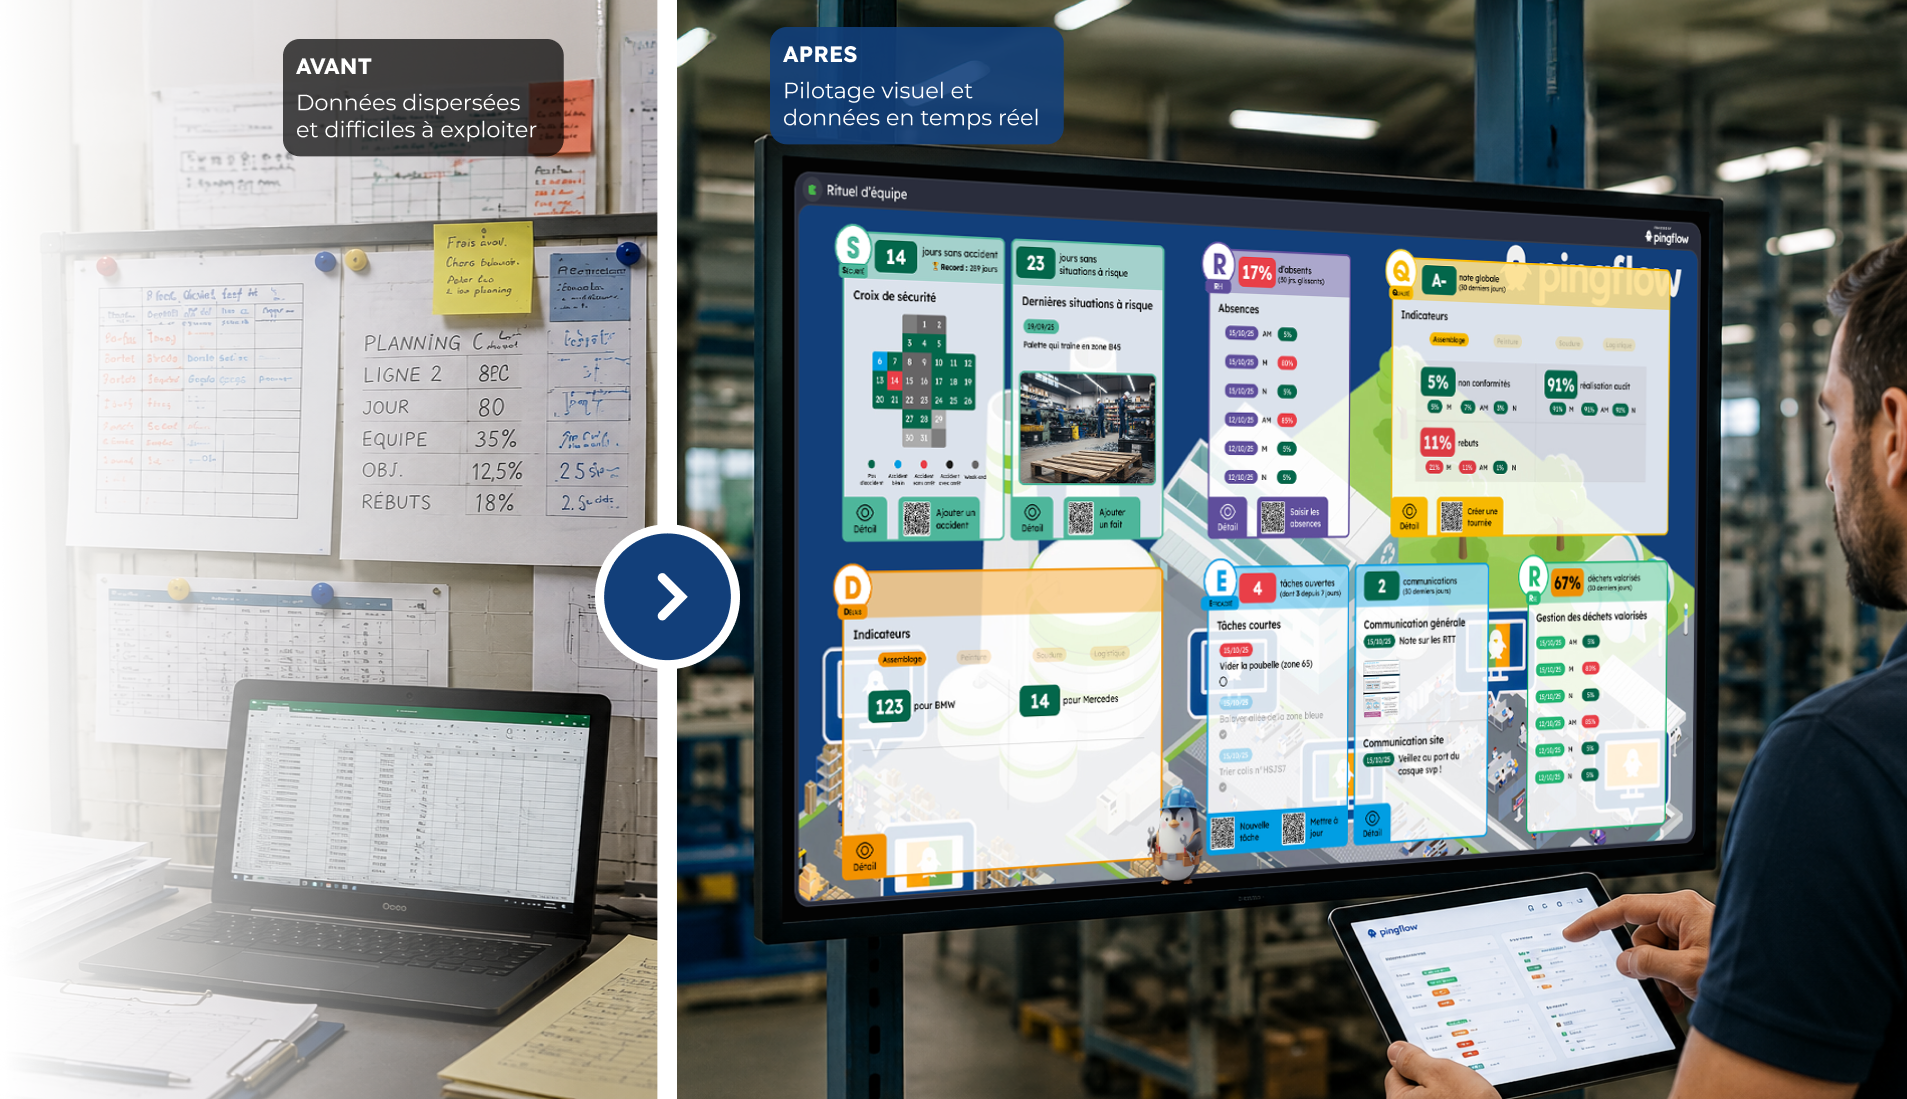
Photo d'un avant après Pingflow avec à gauche beaucoup de papier et tableau blanc et à droite un écran connecté de management visuel digital

Remplacer Excel en production : pourquoi les ateliers passent au pilotage en temps réel

ChapitrageLe coût caché d’Excel en atelierPourquoi Excel pose-t-il problème en production industrielle ?Par quoi remplacer Excel en usine ?Excel peut-il être utilisé pour le suivi de production ?Quelle différence entre Excel et un logiciel de...
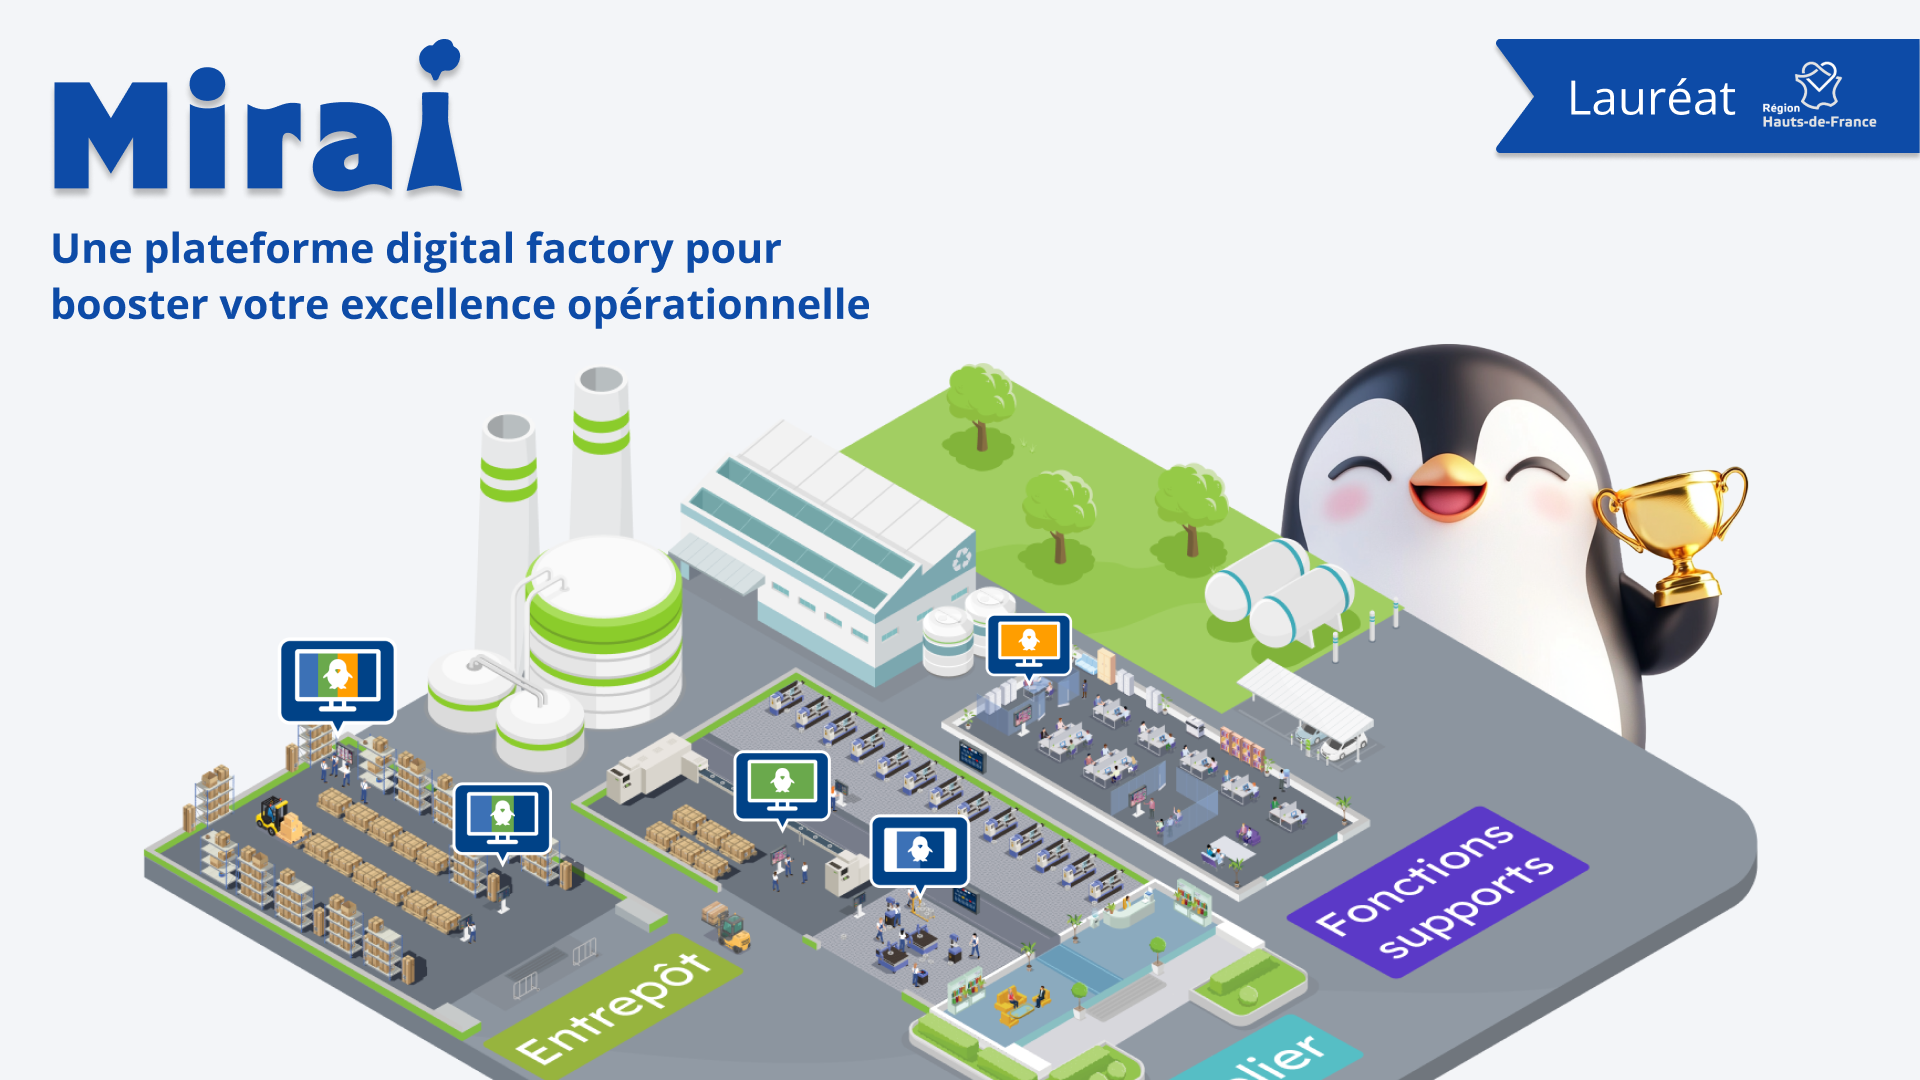
Image d'illustration du projet Mirai by Pingflow, lauréat HDF

Mirai, l’industrie du futur à hauteur d’humain

Une nouvelle ère pour les PME et ETI industrielles en Hauts-de-France L’industrie 4.0 fait rêver. Pilotage en temps réel, capteurs intelligents, intelligence artificielle, automatisation… Mais dans les faits ? Ces outils restent souvent hors de...
illustration pingouin devant une base table

Table : La révolution collaborative au service de vos données connectées à Pingview

À l’heure où les données s’accumulent toujours davantage, les opérateurs et superviseurs ont souvent du mal à en tirer quelque chose de concret. Entre les feuilles volantes, les fichiers Excel et les infos qui se perdent, structurer et exploiter...
opérateurs en industrie

No Code/Low Code : la voie royale pour digitaliser vos usines ?

Développer plus vite, sans savoir programmer, des applications conçues par et pour vos équipes : la promesse des plateformes No (ou Low) Code est belle. Comment cela se traduit-il au niveau de la production, et comment tirer parti des potentialités...

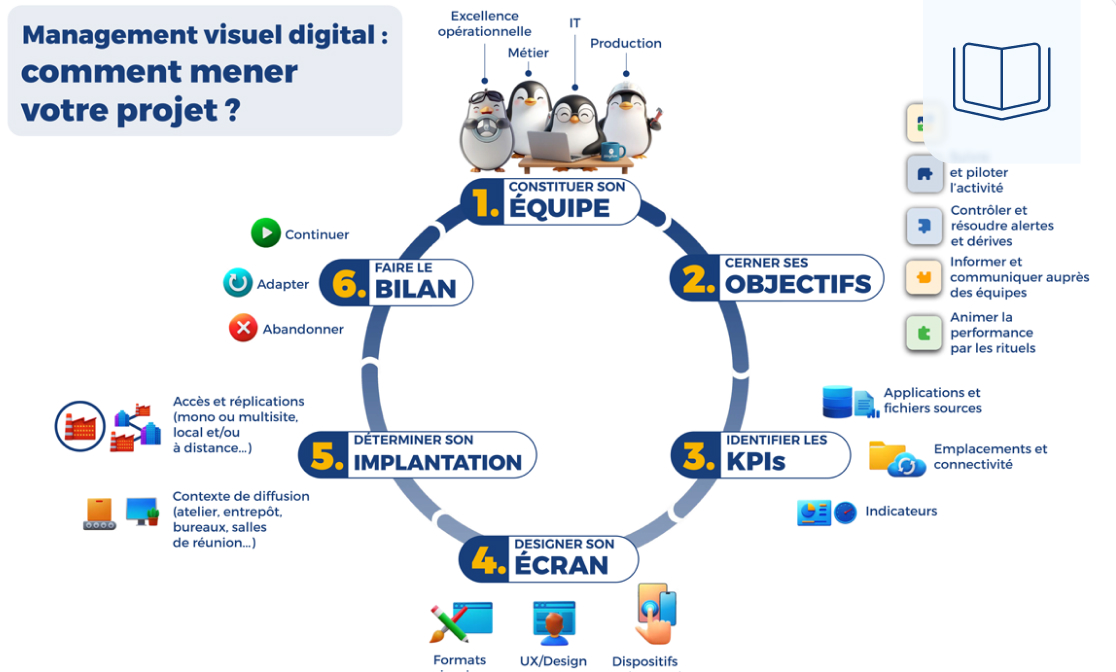
6 étapes pour mettre en place le management visuel digital dans votre équipe

Au sein d’une unité de production ou sur un site entier, des services « support » aux expéditions : le management visuel digital accélère le partage de l’information et la prise de décisions, favorise l’autonomie des collaborateurs,...
wallboard rituel sqcdp

SQCDP dans l’industrie : de quoi s’agit-il, et comment en tirer bénéfice ?

De nombreux industriels utilisent déjà le SQCDP digital pour piloter leurs performances en temps réel. ChapitrageSQCDP : 5 batteries d’indicateurs pour piloter la performance opérationnelleAppliquer la méthode SQCDP : 3 étapes pour la mettre en...
opérateurs heureux

Gemba Walk (tournée de terrain) et rituels d’Animation à Intervalle Court (AIC) : pourquoi opter pour leur digitalisation ?

Gemba Walk, AIC, tournée de terrain… sont des concepts massivement utilisés dans l’industrie.Encore faut-il savoir à quoi ils renvoient ! Opérateurs effectuant une tournée de terrain Le Gemba Walk, aussi appelé tournée de terrain, désigne l’action...
interface Pingplay de Pingflow

Pingplay, la gestion simplifiée, à distance, de votre parc d’écrans

Diffusez votre contenu sur n’importe quel écran en quelques clics. La plateforme Pingplay vous permet d’administrer l’ensemble des players connectés à vos écrans. Administrez votre parc d'écrans en toute simplicité La...
deux personnes devant un wallboard rituel d'équipe

Qu’est-ce qu’une animation à intervalles courts (AIC) : définition, fonctionnement, facteurs clés de succès

Courtes, participatives et suivies de plans d’action, les AIC sont l’un des piliers du pilotage de la performance dans l’industrie. En respectant leurs principes de fonctionnement et d’animation, elles favorisent l’engagement des équipes dans...
modèle wallboard pingflow croix sécurité

Qu’est-ce qu’une croix sécurité, et comment l’intégrer à vos rituels de management visuel ?

Grâce à sa représentation synthétique de “l’historique sécurité” d’une unité de production, la croix sécurité permet de rendre visible les progrès accomplis, et d’impliquer tous les collaborateurs dans la maîtrise des risques. Qu’est-ce qu’une...
Vue sur une aile d'avion dans le ciel

Obtenez le label Gold Aero Excellence grâce à Pingflow !

L’industrie aéronautique et spatiale est en pleine transformation. Face aux exigences croissantes des donneurs d’ordres, le référentiel Aero Excellence du GIFAS (Groupement des Industries Françaises Aéronautiques et...
modele rituel equipe aic

Rituels d’équipe : découvrez le nouveau modèle

Animez vos rituels d’équipe en toute simplicité ! Découvrez le nouveau modèle d’animation d’équipe AIC de Pingflow ! Conçu pour optimiser la gestion de la sécurité, de la qualité et de la performance, ce tableau de bord digital facilite...
sources pingview

Les connexions dans Pingview : une plateforme de données ouverte et sécurisée

Pingview est une solution qui facilite l’intégration et la visualisation de données issues de multiples sources, avec une gestion des connexions simple, sécurisée et flexible. Que ce soit via des services web, des fichiers, des bases de données ou...
operateurs devant un pupitre

Industrie 4.0 : le pupitre connecté pour les frontline workers

Ces dernières années, les managers ont été les premiers à bénéficier de nouveaux outils numériques déployés pour faciliter et faire évoluer leurs missions (comme Microsoft 365 avec Teams et Power BI par exemple). A contrario, les acteurs...
comparatif pingflow

ERP, MES, BI, management visuel… ou Pingflow : quelles solutions pour digitaliser son usine ?

Pingflow : une solution de management visuel connecté De quoi s’agit-il ? Pingflow est une solution de management visuel digital, qui intègre : Le suivi de production ou d’activité en temps réel, alternative agile  ou complémentaire au MES...