6 steps to implement digital visual management in your team

Sep 17, 2025

🕐 Temps de lecture : 5 minutes

For a company or team that is wondering about the implementation of lean management methods and its multiple derivatives (lean IT and scrum methodology, lean manufacturing, lean office for the tertiary sector
), a project quickly proves to be a priority: the implementation of visual management.

In fact, without providing clear information and indicators, the autonomy of involved teams in a lean approach will remain a dead letter. And if this information is not updated in real time, or not accessible to the entire team, it’s the agility needed for lean that takes a hit.

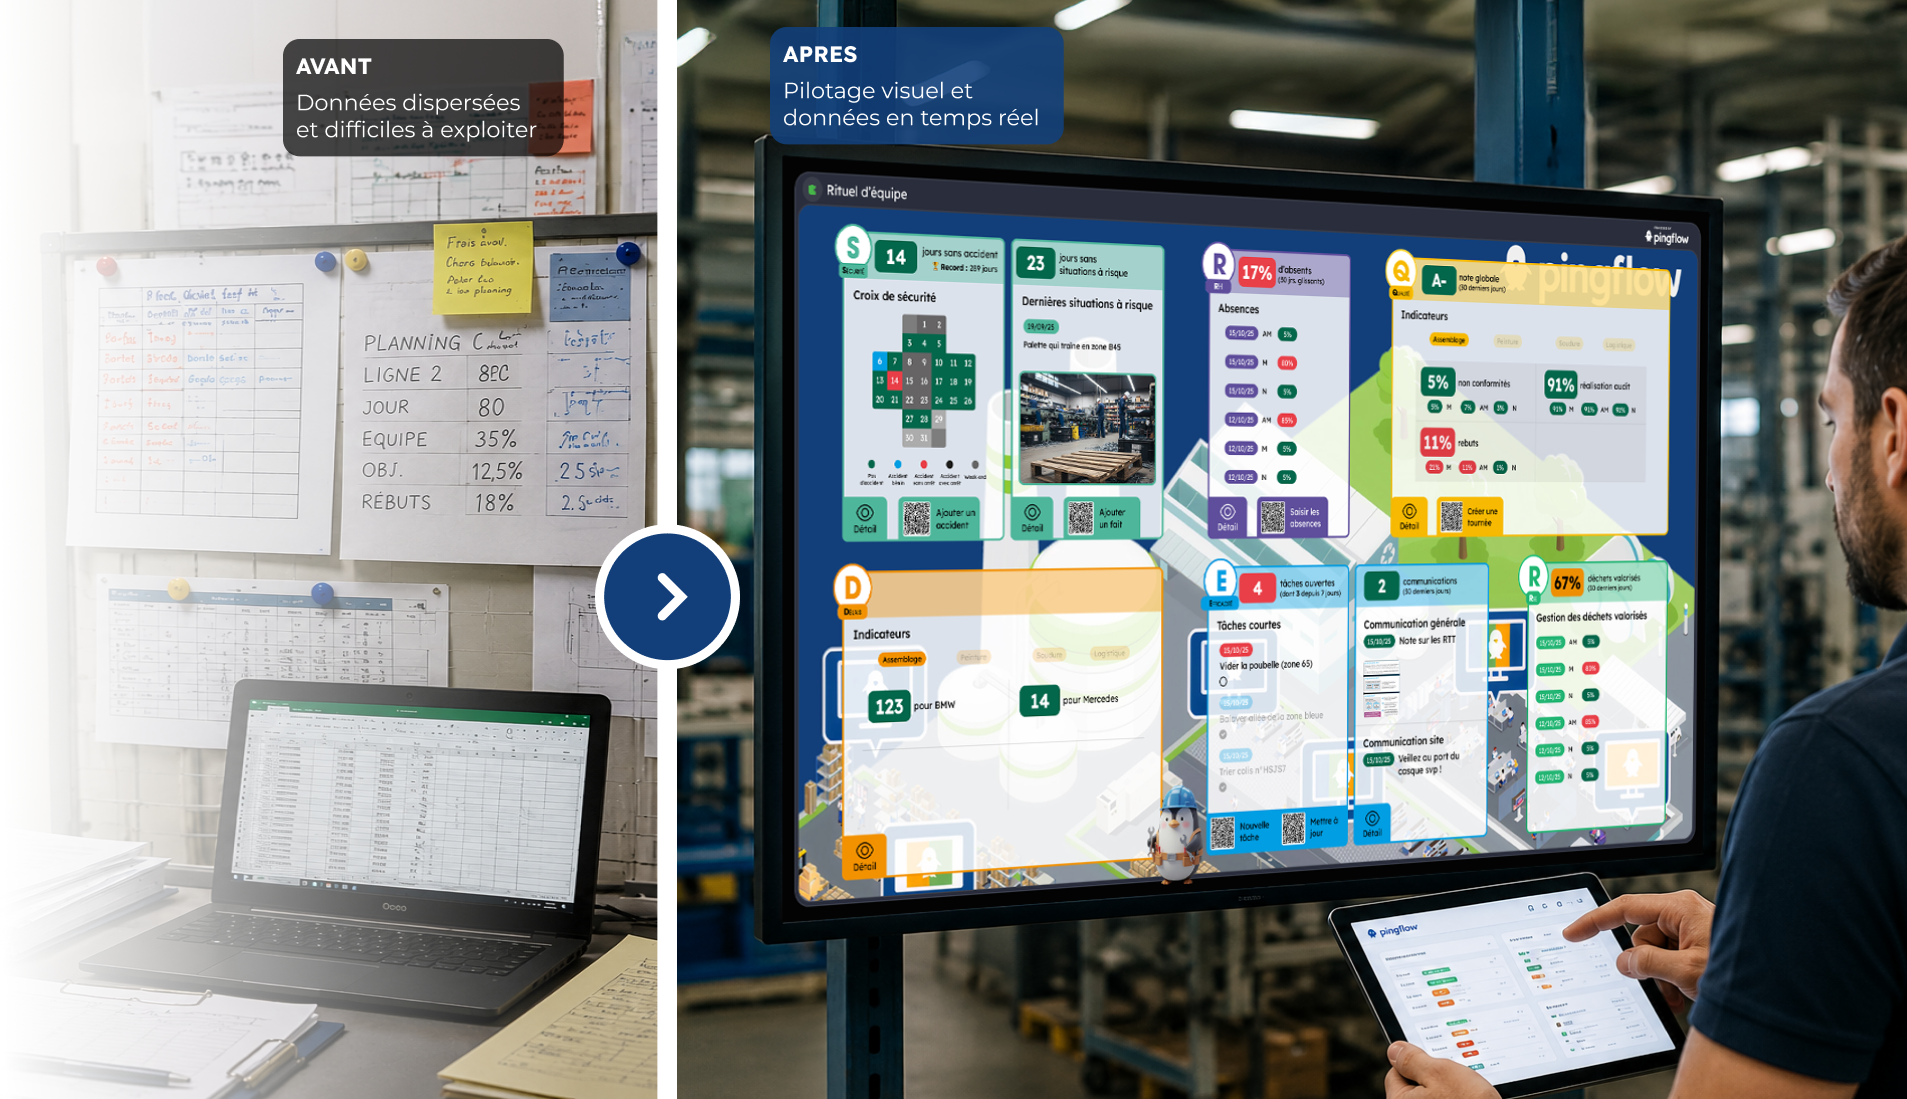
In other words, not only is visual management the cornerstone of any lean project, but this visual management gains enormously in digitizing itself: digital allows you to collect and reconcile often heterogeneous and scattered data, to automate their updating, and display them on the most suitable media (such as our wallboards). It remains to be seen how to implement this digital visual management.

In advance: test visual management via a POC

You don’t revolutionize your team’s management methods and supports with a magic wand. On a subject where the human factor is by definition primordial, and where benefits and impacts are difficult to anticipate, it is better to move forward in “project” mode. Then get things back on track, keep what works and get rid of false good ideas.

This is precisely what a POC (Proof of Concept) allows. Flexible and limited in time, a POC is indeed intended to test “in vivo” an idea on a small scope. Then learn from it before generalizing the experience, reviewing it
 or abandoning it without damage.

In the context of a visual management project, clearly defining your POC will require choices on:

  • its objectives: what information, process, parts of the team’s work will be sought to make them flow better
  • its expected results: how to measure POC’s success (or failure)
  • its timing: in general, 3 to 4 months will be enough to learn lessons

For more information, we invite you to read our article about the digital POC. What’s next? It will take place in 6 steps.

infographie projet management visuel digital

Step 1 : build your team

This is a crucial but delicate step. By nature, a lean approach involves breaking silos between services, thus integrating as many stakeholders as possible. On the other hand, a multiplicity of viewpoints will allow you to ensure the relevance of visual management that will emerge from your POC.

But the temptation to include as many interlocutors as possible will be a hindrance to the successful progress of the project. Building a small but representative “task force” of people involved in the project is therefore the key. At a minimum, we can consider that your team will have to include:

  • a project leader
  • a representative of the business line directly concerned
  • a representative of IT
  • an internal communication professional

Nothing prevents the organization of intermediate points with a slightly wider public, to collect their feedback. Finally, having a “sponsor” on the management committee or executive committee will also be a plus when it comes to deploying visual management on a larger scale


Step 2 : identify the challenges of your visual management

C’est avec cette Ă©quipe projet, et de façon collaborative, que vous allez ensuite affiner vos objectifs. Que cherchez-vous Ă  It’s with this project team, and collaboratively, that you will then refine your objectives. What are you trying to achieve with visual management?

  • Display the right information to employees?
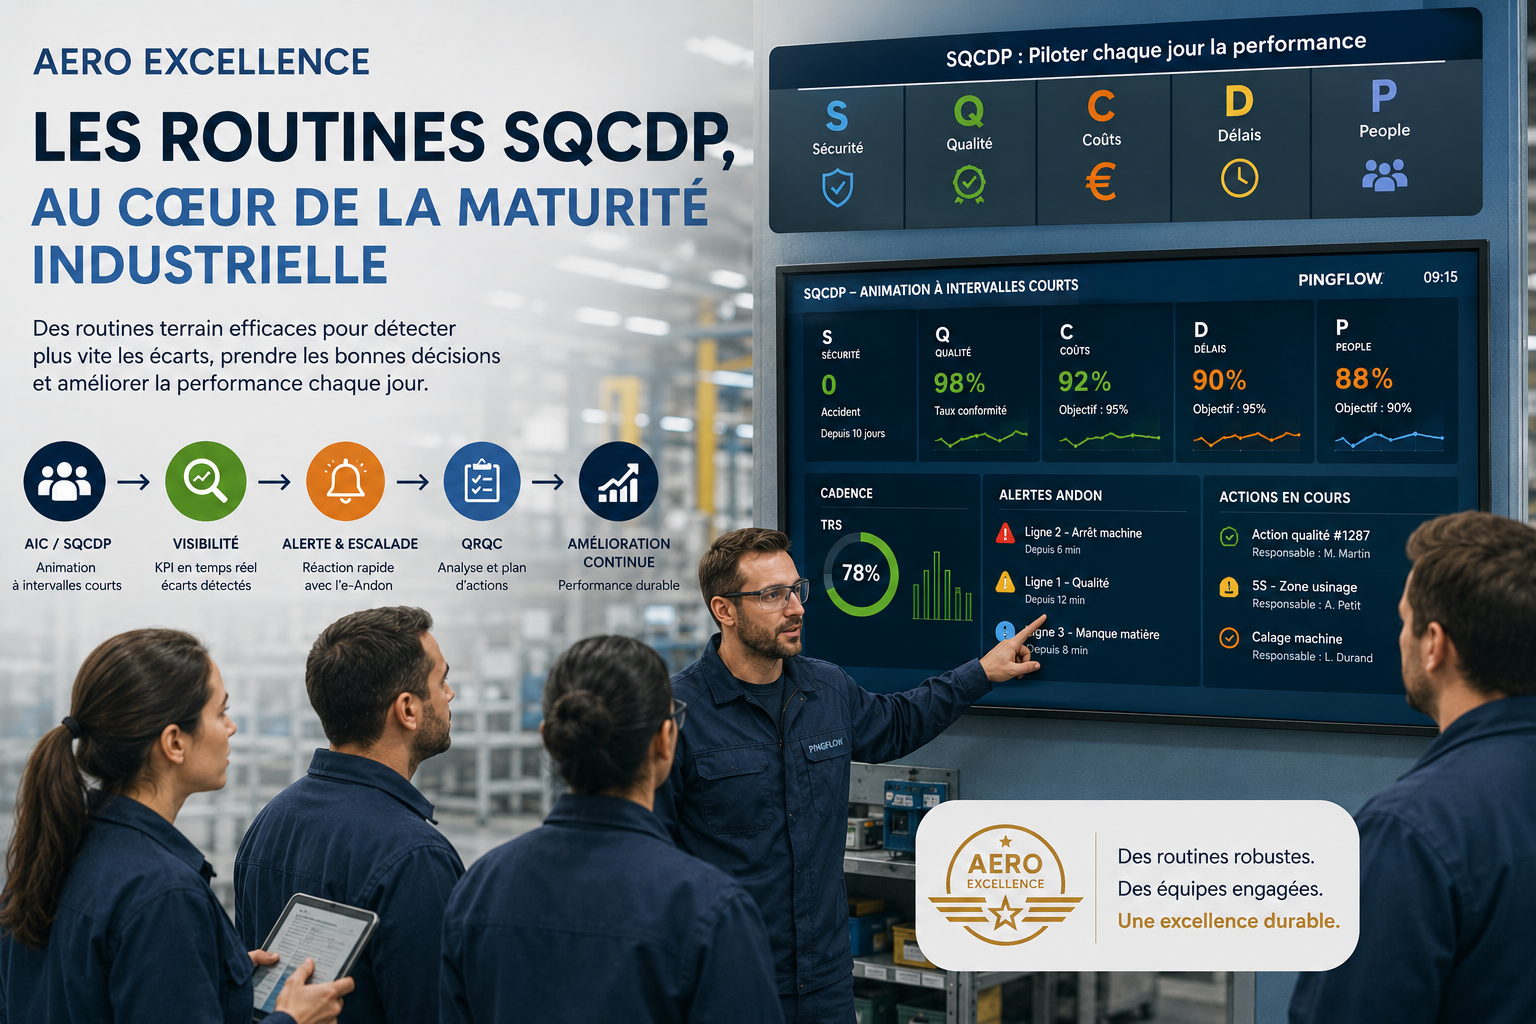
  • Push the KPIs analysis further and trigger activity alerts?
  • Manage processes and workflow to achieve operational excellence?

Simply informative or completely interactive: there are indeed different degrees in visual management. It is up to you and your employees to determine how far your ambitions go – under the POC and beyond.

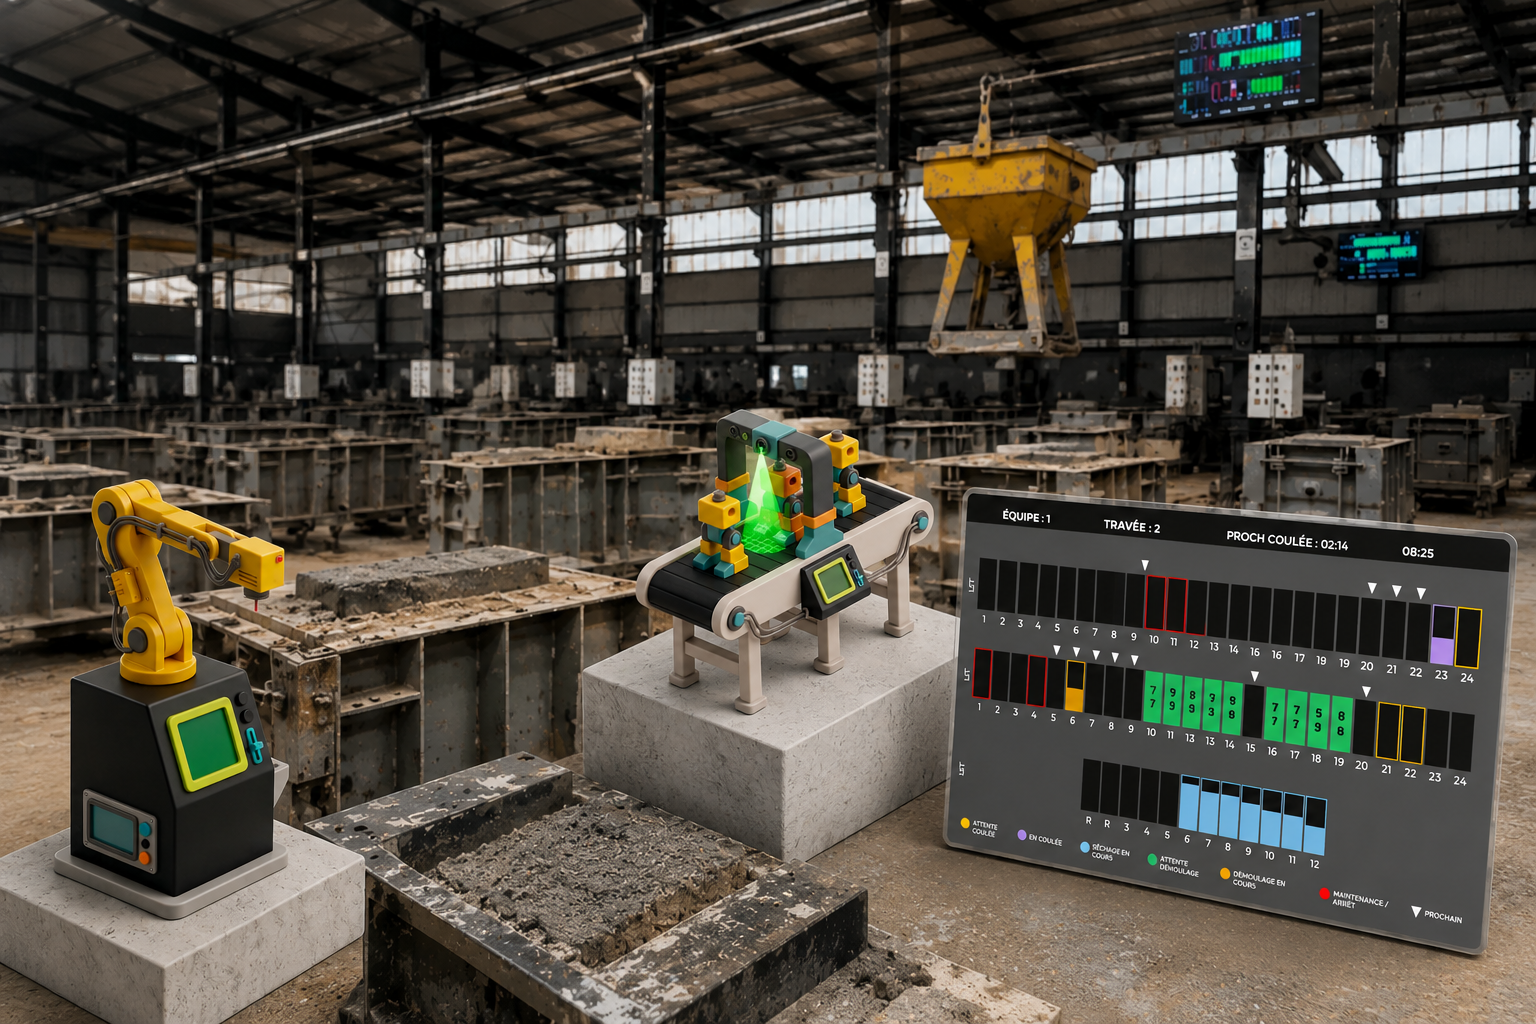
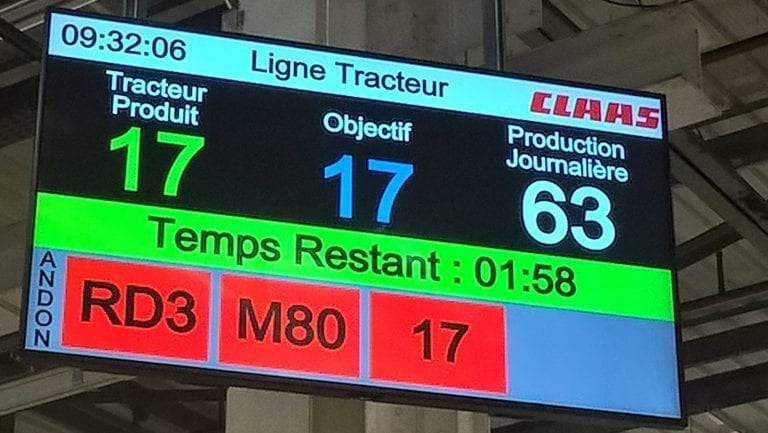
This second step is even more structuring than the first one. Because depending on the objectives pursued, the type of data and the form in which they are presented will vary considerably. In the same industrial context, a warning system such as Andon or process control such as Kamishibai represent completely different approaches. And there are many other possibilities


Step 3 : identify your KPIs (and sort them!)

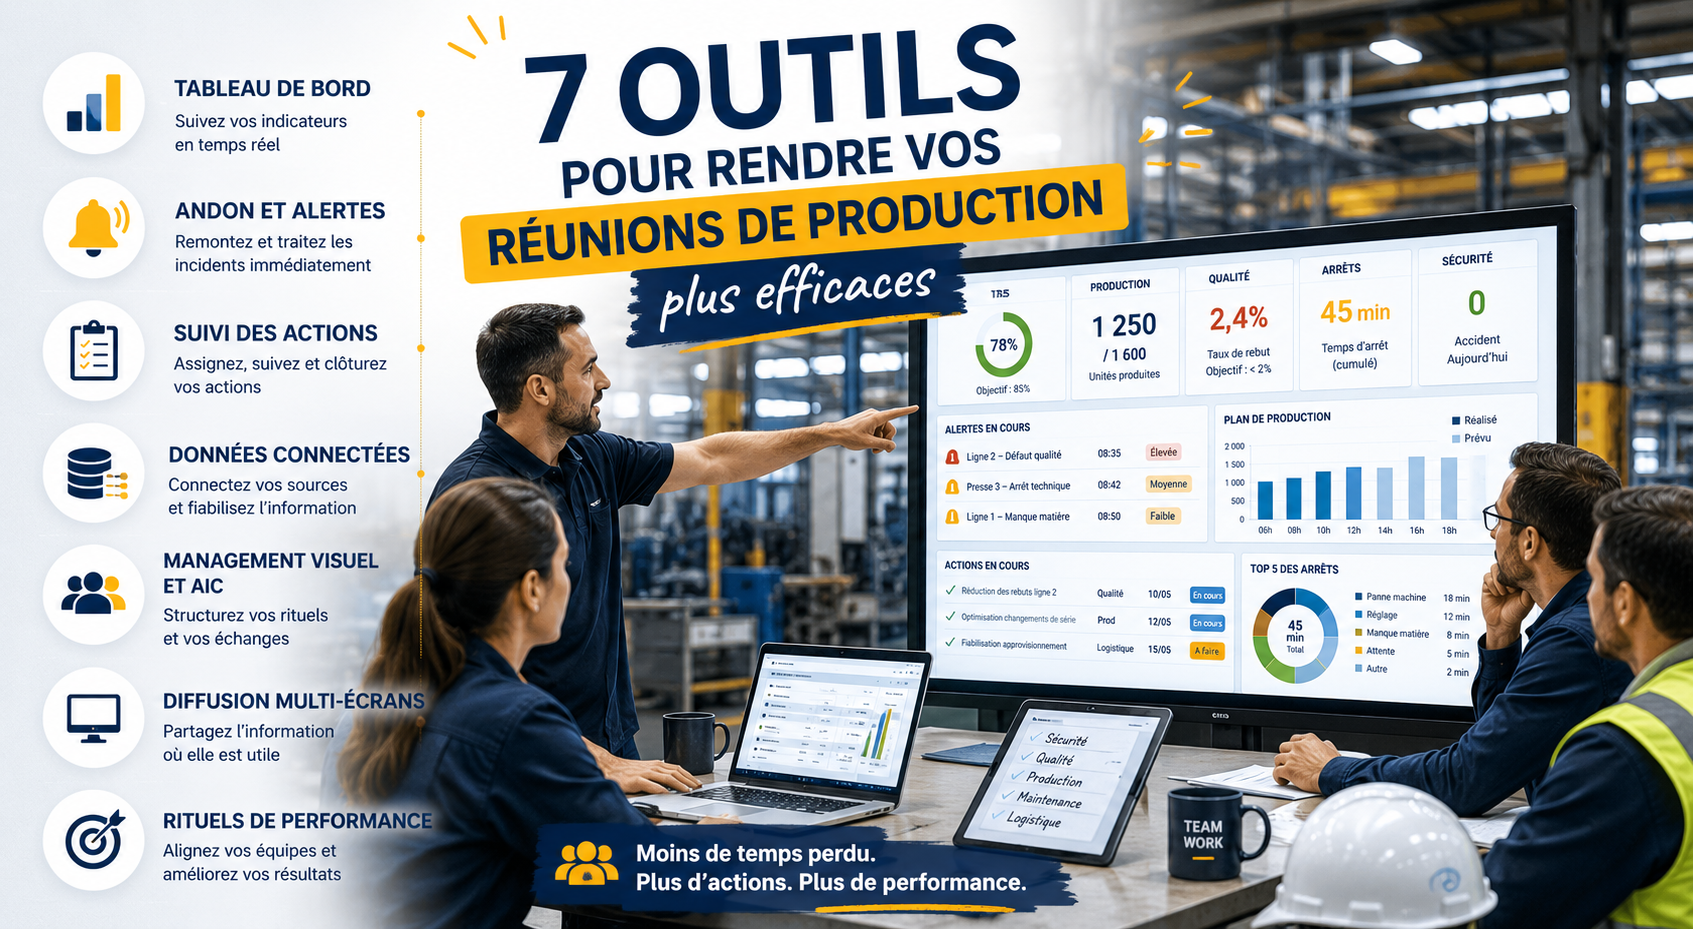
This is of course the key moment of your POC: without data, no key performance indicator (KPI), and therefore no visual management. The first step will therefore be to determine which indicators are essential, interesting and optional for the future of the project. Depending on targeted audience, monitored activity, and frequency of data updates, you will already have a good idea of this first sort.

Because that’s what sort is all about: beyond 5 indicators per screen, the screen will become unreadable. Even if digital technology makes it possible to design deeper visual management systems (with second screens, zooms, links, etc), simplicity is always the best policy.

Next operations? Define at the same time:

  • files, databases and other applications where the data necessary for the construction of your indicators is stocked
  • the available flows, or the connections you will need to establish to get them back: API, Web-services


Scope is extremely broad (the presence of a member of IT team in your POC takes on its full meaning
): the needs of our clients range from office equipment (Office, Google site) to project management applications (Trello, Slack) and ERP (SAP), via helpdesks or database managers software (Mysql, Oracle).

If you want to know more about the choice of KPIs, and the organization of visual management, take a look at our video of Caisse d’Epargne Hauts-de-France’s return of experience:

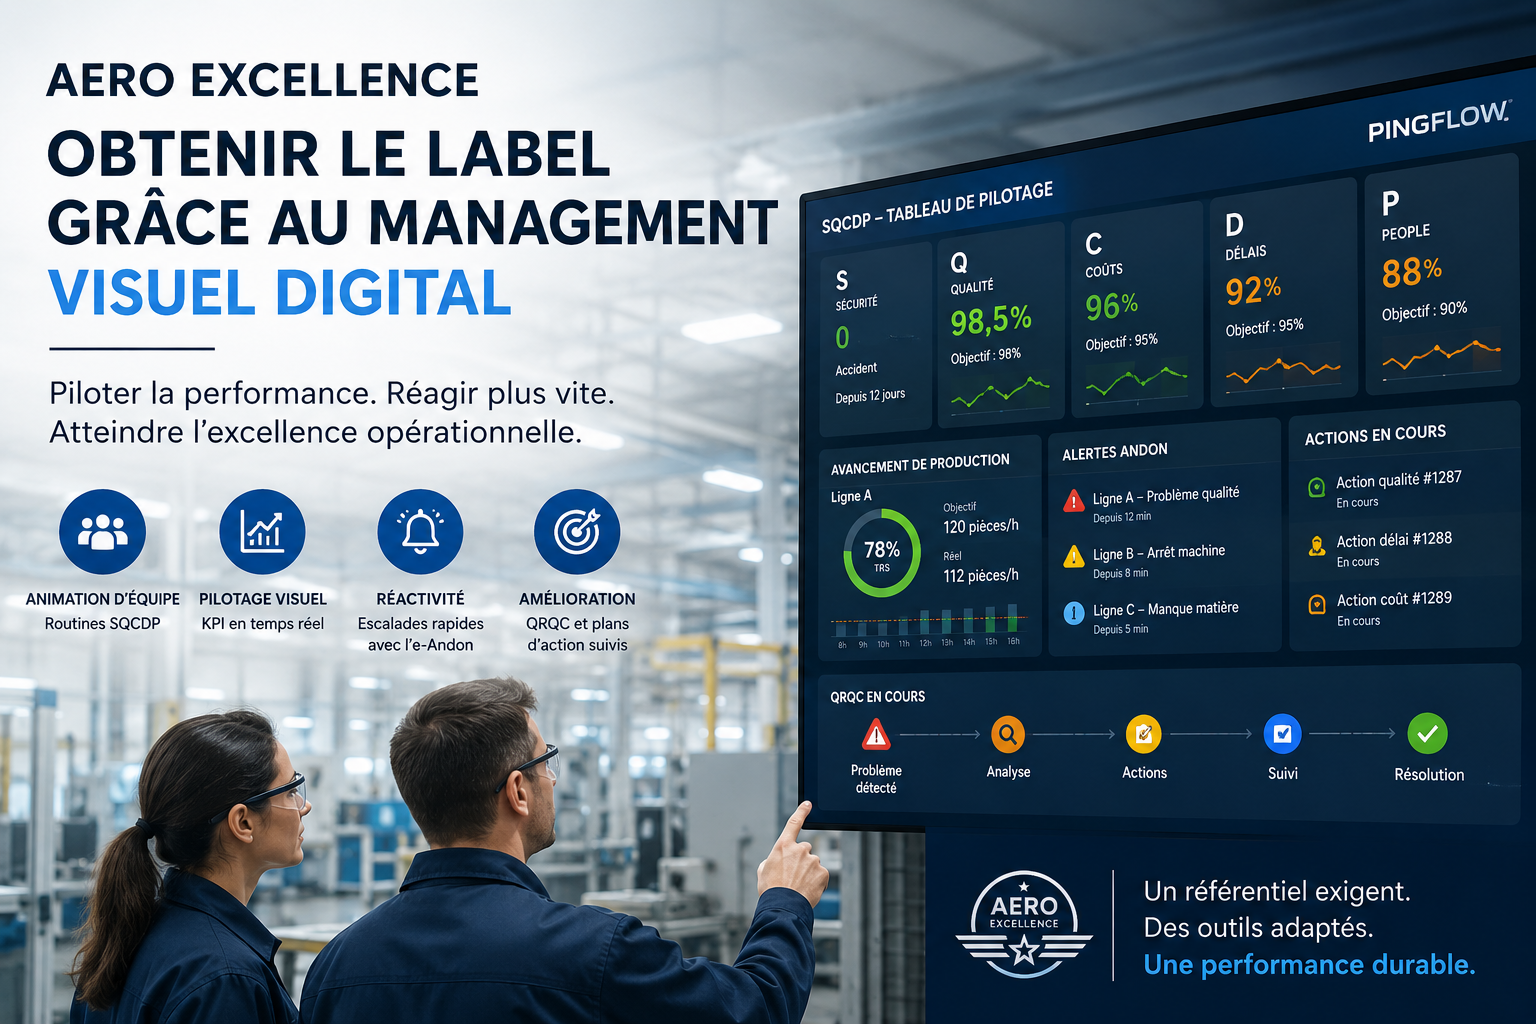
Step 4 : design your visual management screen

Qui dit management visuel dit mise en forme. Et qui dit digital dit forcĂ©ment Ă©cran. Le design de l’écran qui va constituer le Visual management means shaping. And digital necessarily means screen. Design of the screen that will constitute the “media” of your management plays a crucial role in the success of your POC. And it is especially at this time that inviting a “Mr. (or Mrs) Communication” into your working group will prove very useful.

Objectives of this step during which it will be to make your visual management system as attractive as it is effective:

  • Avoid over-information
  • Provide visual information animation conditions
  • Think about ergonomics and interactions if you choose a touch screen for example

From the choice of visual formats (histograms or pie charts, simple numbers or even traffic lights) to the choice of font, action buttons, colors
 It’s a real designer job waiting for you on this step. Work that you must carry out with the desired type of screen in mind: touch-sensitive or not? Arranged in portrait, landscape or swiveling?

Step 5 : choose the right display points

Misplaced, the most beautiful screen in the world won’t do you much good
 Beyond its design and the information it provides, the choice of its location will be truly strategic.

How to choose it right? First, based on the targeted audience: its places of passage, work, break
 Is it a single-site team or scattered? Then according to the rhythm of the activity you want to “monitor” thanks to visual management: is one screen enough? Some? Much more than that?

In some cases, a single screen in a “control room” type Obeya will amply be enough. In others, it will be necessary to invest several common areas or office floors, etc. A final point to take into account: the size of the screen(s) chosen, so that it is both visible and can be easily used by your teams.

Step 6 : take stock
 and iterate to generalize visual management

Has your POC come to an end? This is just the beginning
 After a few weeks of use, it will be time to take stock of this project. And this in several dimensions:

  • What works (and works less well) in the visual management set up: what information is missing, is too much, is poorly presented

  • What worked (or didn’t) during the project. At what steps can we save time or did we go too fast? What skills did you lack in your task force?
  • What is generalizable (or not). Can this POC serve as a basis for another project in the company, or even in your department? What have you learned What needs to be improved, kept, abandoned
 ?

To go further


Explore all our articles to discover real-life cases and get practical advice for digitizing your industrial site.
Illustration d'un pingouin qui dit "celui-ci est particuliÚrement intéressant !"
Exemples de KPI Tree Industriel

KPI Tree industriel : comment structurer vos indicateurs pour piloter réellement la performance

📊 Un constat frĂ©quent en industrie Votre usine suit peut-ĂȘtre 80 KPI. Pourtant, si l'on vous demande lesquels expliquent rĂ©ellement une baisse du TRS, la rĂ©ponse prendra sans doute plusieurs minutes. Ce n'est pas un problĂšme de donnĂ©es. C'est un...
Opérateur montrant un écran ERP ou MES à quelqu'un du bureau

Guide intégration ERP MES terrain : réussir la connexion entre les systÚmes et les équipes

Sur le terrain, l'échec d'une intégration ERP-MES ne vient presque jamais du connecteur. Il apparaßt généralement plusieurs semaines aprÚs la mise en service, lorsqu'un responsable de production découvre que les données remontent correctement dans...
Image illustrant le suivi de production automatisé chez FBA

Fiabiliser et optimiser le pilotage : comment automatiser votre suivi de production ?

ChapitrageSystĂšme manuel vs systĂšme automatisĂ© : qu’est-ce qu’on y gagne ?Le suivi de l’activitĂ© : plus robuste, plus prĂ©cisLe monitoring de la production : vraiment temps rĂ©elLa performance : gain de temps Ă  tous les niveauxChez FBA, des balises...
Réunion de production industrielle avec tableau de bord en temps réel et outils de management visuel digital. L'image présente les principaux outils pour réunions de production efficaces : Andon, suivi des actions, données connectées, AIC, diffusion multi-écrans et pilotage de la performance en usine.

7 outils pour rendre vos réunions de production réellement efficaces

ChapitragePourquoi les rĂ©unions de production dĂ©raillent encoreLes 7 outilsQuels indicateurs suivre pendant une rĂ©union de production ?Les erreurs les plus frĂ©quentesCe qu'une bonne rĂ©union doit produire À 9 h 02, la rĂ©union de production a dĂ©jĂ ...
Personnes devant un écran montrant un logiciel de pilotage visuel

Logiciel de pilotage visuel en usine : comment choisir une solution utile au terrain

À 8h05, le point d’équipe commence.Le tableau blanc n’est pas Ă  jour, les chiffres de la veille circulent encore sur un fichier Excel, et l’alerte qualitĂ© de nuit n’a pas Ă©tĂ© remontĂ©e au bon niveau. RĂ©sultat : les Ă©quipes passent les dix premiĂšres...
Aperçu d'une checklist dans devant un écran digital au milieu d'un shopfloor en préparation pour le label aero excellence

Comment préparer une évaluation Aero Excellence quand on est une PME industrielle

Quand on parle d’Aero Excellence, beaucoup de PME aĂ©ronautiques ont exactement la mĂȘme rĂ©action : “C’est surtout un sujet pour Airbus, Safran ou les trĂšs gros sites industriels.” Et honnĂȘtement, cette impression est comprĂ©hensible. Quand on...
Image d'illustration d'un homme dans un atelier à cÎté d'un avion. Il regard un écran affichant différent KPI connectés à la production pour le label aero excellence

Pourquoi Excel ne suffit plus pour Aero Excellence

ChapitrageAero Excellence pousse les industriels vers une logique de pilotage temps rĂ©elLe vrai problĂšme d’Excel dans un contexte Aero ExcellenceLe vrai sujet : KPI de reporting ou KPI de pilotage ?Pourquoi le “Production Pace Management” devient...
Une femme dans un atelier devant un avion avec une tablette Ă  la main suivant les andons

Comment rĂ©duire les temps de rĂ©action pour Aero Excellence avec l’Andon

ChapitragePourquoi Aero Excellence pousse les industriels vers une logique de rĂ©action rapidePourquoi les systĂšmes Andon traditionnels atteignent leurs limitesL’e-Andon transforme l’incident en donnĂ©e pilotableLe MTTR devient un indicateur clĂ© de...
Images illustrant le lien entre SQCDP et Aero Excellence

Pourquoi les routines SQCDP sont devenues centrales dans Aero Excellence

ChapitragePourquoi Aero Excellence accorde autant d’importance aux routines terrainLe vrai problùme des SQCDP papierPourquoi les routines digitales changent complùtement la dynamiqueLe lien direct entre SQCDP et Aero ExcellencePourquoi l’AIC...
header label aeroexcellence

Comment obtenir le label Aero Excellence grĂące au management visuel digital

ChapitrageAero Excellence : un référentiel pensé pour le terrainCe que les évaluateurs regardent vraiment dans les ateliersPourquoi Excel devient un frein à la maturité industrielleLe management visuel digital change complÚtement la logiqueComment...
Photo d'un avant aprÚs Pingflow avec à gauche beaucoup de papier et tableau blanc et à droite un écran connecté de management visuel digital

Remplacer Excel en production : pourquoi les ateliers passent au pilotage en temps réel

ChapitrageLe coĂ»t cachĂ© d’Excel en atelierPourquoi Excel pose-t-il problĂšme en production industrielle ?Par quoi remplacer Excel en usine ?Excel peut-il ĂȘtre utilisĂ© pour le suivi de production ?Quelle diffĂ©rence entre Excel et un logiciel de...
Homme de dos dans une usine tenant une tablette avec du suivi d'activité en temps réel

Le suivi d’activitĂ© en temps rĂ©el en usine

ChapitragePourquoi le suivi d’activitĂ© en temps rĂ©el devient un standardCe que le temps rĂ©el change vraiment sur le shopfloorLe management visuel comme colonne vertĂ©brale du temps rĂ©elQuels indicateurs suivre en temps rĂ©el, et lesquels...
SystÚme andon connecté en usine

SystÚme Andon connecté : utile ou décisif ?

Table des matiĂšresL’essentiel Ă  retenir👉 À lire aussi :Quelle diffĂ©rence entre un Andon classique et un Andon connectĂ© ?Un Andon connectĂ© amĂ©liore-t-il le TRS ?Peut-on connecter un systĂšme Andon Ă  un ERP ou un MES ?L’Andon connectĂ© est-il utile en...
Before/after Bils Deroo management visuel

Pourquoi passer au management visuel 4.0 ?

Pourquoi passer au management visuel 4.0 ? Pour gagner en réactivité, fiabilité et alignement terrain avec des données utiles en temps réel.

Pierre Jolimont et Benoit Hutin chez Toyotomi Europe

Comment Toyotomi a rĂ©duit ses arrĂȘts de production de 20 % grĂące Ă  l’Andon digital

Passer du pilotage en J+1 au temps réel : un enjeu clé pour les industriels Il y a deux façons de piloter une usine : la premiÚre consiste à constater, la seconde consiste à voir. Dans le premier cas, on analyse les résultats en fin de poste, en...
Photo d'une animation d'équipe à l'aide du management visuel digital Pingflow chez le Groupe Bils-Deroo

Groupe Bils-Deroo : structurer un projet de management visuel digital en logistique

Dans un secteur logistique sous forte pression concurrentielle, oĂč les marges sont faibles et la complexitĂ© Ă©levĂ©e, le Groupe Bils-Deroo a fait un choix stratĂ©gique : structurer son pilotage grĂące au management visuel digital. Groupe Bils-Deroo...
Photo des partenaires lors du lancement de Mirai

Mirai : un projet collaboratif pour rĂ©inventer le management visuel avec l’andon IA

Mirai s’inscrit dans le cadre du programme Industrie du Futur portĂ© par la RĂ©gion Hauts-de-France. Le projet a Ă©tĂ© sĂ©lectionnĂ© pour son ambition : rendre les outils de pilotage industriel plus accessibles, plus intelligents et plus directement...
personnes effectuant une tournée de terrain

Management visuel et lean : les 4 piliers du management visuel 4.0

Dans un contexte industriel oĂč la performance, l’agilitĂ© et la rĂ©activitĂ© sont devenues incontournables, le management visuel de la performance s’impose comme l’un des leviers les plus puissants du lean management. Il permet de donner du sens aux...
rituel sqcdp chez metso

Metso : des wallboards digitaux pour “aligner” l’ensemble de sa production

De la vente aux expĂ©ditions, en passant par l’usinage et l’assemblage : en impliquant l’ensemble de ses Ă©quipes dans l’amĂ©lioration des rituels d’animation (AIC), l’usine de Metso de MĂącon a considĂ©rablement fluidifiĂ© la visibilitĂ© des...
ecran andon pingflow chez claas

e-Andon : comment mettre en place un systùme d’alerte digitale dans mon usine ?

À l’origine simple systĂšme d’alerte visuelle et sonore dĂ©clenchĂ©e par un opĂ©rateur pour signaler un incident ou un dysfonctionnement, l’Andon a beaucoup Ă©voluĂ© ces derniĂšres annĂ©es, avec notamment des innovations concernant les dispositifs...
Modal webinaire Pingflow